imaginima
Introduction
The Oklahoma City-based Devon Energy Corporation (NYSE:DVN) reported first-quarter 2023 results on May 8, 2023.
Important note: This article updates my preceding article, published on April 2, 2023. I have followed DVN on Seeking Alpha since 2017.
Devon Energy is a pure E&P domestic player, operating in five different basins.
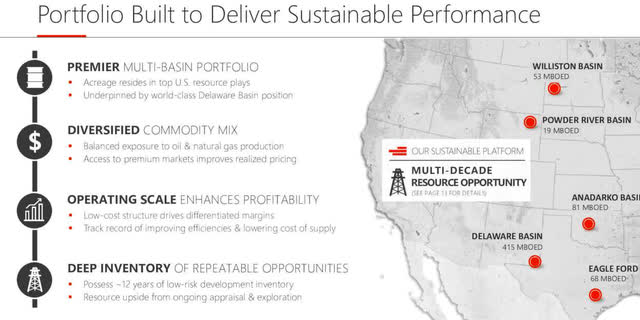
DVN Assets Portfolio (DVN Presentation)
1 – 1Q23 Results Snapshot
Devon Energy announced higher-than-expected adjusted earnings of $1.46 from $1.88 a year ago.
GAAP earnings for the first quarter were $1.53 compared to $1.48 per share in the year-ago period.
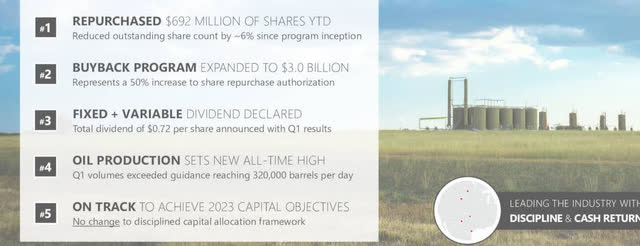
DVN 1Q23 Takeaways (DVN Presentation)
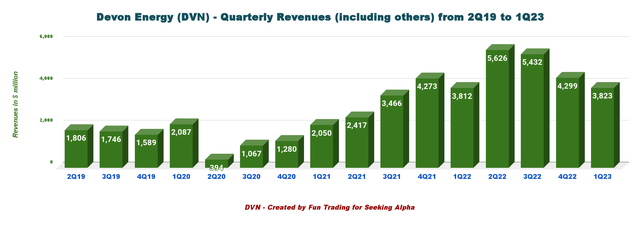
The total revenues were $3,823 million, slightly higher than the same quarter a year ago ($3,812 million).
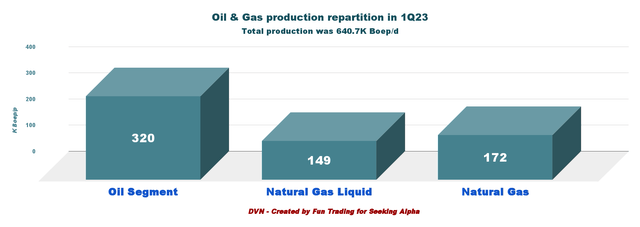
Oil production averaged 320K Boep/d. The first-quarter production of 640.7K Boep/d (a new all-time high) is up from 575K Boep/d in 1Q22. However, the increase was reduced by approximately 2% due to the impact of severe weather conditions.
CEO Richard Muncrief said in the conference call:
First, total oil production exceeded our midpoint guidance at 320,000 barrels per day, representing a growth rate of 11% compared to the year ago period. This level of oil production was the highest in our company’s 52-year history. Our strong well productivity in the Delaware Basin was once again a key contributor to this result, and our recently-acquired assets, The Eagle Ford and Williston Basin also provided us higher volumes in the quarter.
2 – Investment Thesis
The investment thesis has not changed since my preceding article, and I continue to recommend DVN as a long-term investment.
However, Devon Energy Corporation weakened significantly in the past few months in correlation with oil and gas prices sinking to their lowest level in more than a year. The situation is uncertain despite Saudi Arabia and Russia’s attempts to support oil prices by cutting supplies. On July 3, 2023, Reuters wrote:
Saudi Arabia said it would extend its voluntary oil output cut of one million barrels per day (bpd) for another month to include August, adding that the cut could be extended beyond that month.
Shortly after the Saudi announcement, Russian Deputy Prime Minister Alexander Novak said Moscow would cut its oil exports by 500,000 barrels per day in August.
The cuts amount to 1.5% of global supply and bring the total pledged by OPEC+ to 5.16 million bpd.
Many analysts believe we are heading to a recession affecting oil and gas demand in the 4Q23. Furthermore, the natural gas price dropped massively in 1Q23, weighing heavily on the free cash flow of companies like DVN.
Hence, I recommend using technical analysis to allocate 45% of your position to trade short-term LIFO. I do not recommend selling off your position and believe it is not a good idea, but taking profit off on uptrends and expecting a lower-low trend for the rest of 2023 is a prudent strategy.
3 – Stock Performance
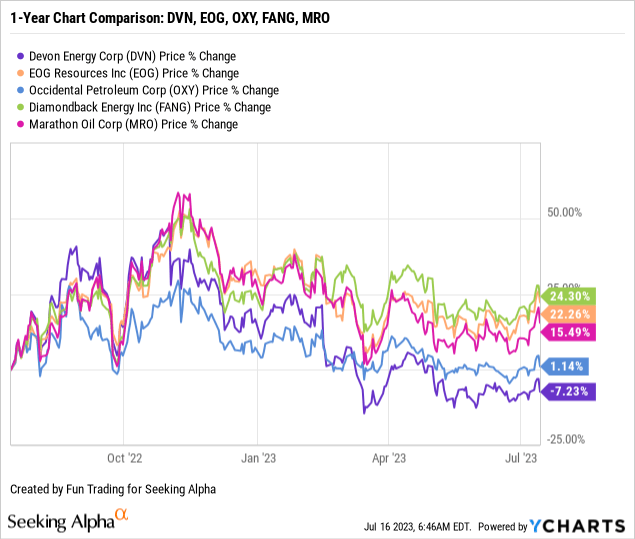
DVN’s underperformed most of its peers and is down 7% YoY.
Devon Energy Balance Sheet History Ending in 1Q23: The Raw Numbers
Note: Total revenues include oil/gas and NGL sales, oil/gas and NGL derivatives, and marketing and midstream revenues.
| DVN | 1Q22 | 2Q22 | 3Q22 | 4Q22 | 1Q23 |
| Oil and Gas Revenue in $ Million | 3,175 | 4,100 | 3,668 | 3,139 | 2,679 |
| Total Revenues incl. derivatives, midstream + others in $ Million | 3,812 | 5,626 | 5,432 | 4,299 | 3,823 |
| Net income in $ Million | 989 | 1,932 | 1,893 | 1,201 | 995 |
| EBITDA in $ Million | 1,843 | 3,116 | 3,138 | 2,271 | 1,932 |
| EPS diluted in $/share | 1.48 | 2,93 | 2.88 | 1.83 | 1.53 |
| Cash from operations in $ Million | 1,837 | 2,678 | 2,104 | 1,911 | 1,677 |
| Capital Expenditure in $ Million | 538 | 673 | 3,093 | 821 | 1,025 |
| Free Cash Flow in $ Million | 1,299 | 2,005 | -989 | 1,090 | 652 |
| Cash and cash equivalent $ Million | 2,475 | 3,317 | 1,185 | 1,314 | 887 |
| Total debt in $ Million | 6,471 | 6,461 | 6,451 | 6,440 | 6,422 |
| Dividend per share in $ | 1.27 | 2.92 | 2.52 | 0.89 | 0.72 |
| Share outstanding in millions | 665 | 660 | 656 | 655 | 653 |
| Liquids and NG Production | 1Q22 | 2Q22 | 3Q22 | 4Q22 | 1Q23 |
| Oil Equivalent Production in KBoepd | 575 | 616 | 614 | 636 | 641 |
| Price per Boe (composite) incl., including cash settlement | 54.75 | 64.70 | 58.48 | 50.62 | 46.66 |
| Price per Mcf | 3.15 | 5.06 | 5.83 | 4.39 | 2.29 |
Source: Devon Energy supplement and Fun Trading Analysis.
Trends, Charts, and Commentary: Revenues, Free Cash Flow, and Upstream Production
1 – Quarterly revenues: Revenues of $3,823 million in 1Q23.
DVN Quarterly Revenue History (Fun Trading)
Note: Revenues from oil and gas were $2,679 million in 1Q23.
Devon Energy posted total revenue of $3,823 million in the first quarter of 2023 versus $3,812 million posted in 1Q22. For more data, please look at the table above.
The net income in 1Q23 was $995 million, up from $989 million last year.
Operating cash flow of $1,677 million against $1,837 million last year.
The total production expenses for the first quarter were $2,599 million, from $2,611 million in 1Q22.
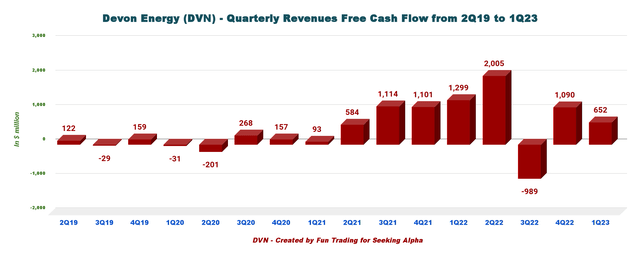
2 – Free cash flow was $652 million in 1Q23
DVN Quarterly Free Cash Flow History (Fun Trading)
Note: The generic free cash flow is the cash from operations minus CapEx. The company has a slightly different way of calculating the FCF, indicating $665 million in 1Q23.
Trailing 12-month free cash flow was $2,758 million and $652 million for 1Q23. CapEx was $1,025 million this quarter.
DVN Shares Repurchased Program (DVN Presentation)
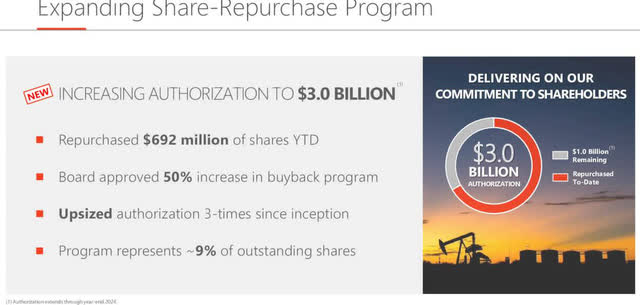
Devon Energy’s share repurchase authorization increased to $3 billion, about 9% of the company’s market capitalization. In the press release (emphasis added):
The company also returned capital to shareholders through the execution of its share-repurchase program. Year-to-date, Devon has repurchased 12.9 million shares at a total cost of $692 million. Since program inception in late 2021, the company has repurchased 38.5 million shares, at a total cost of $2.0 billion. As a result of this buyback activity, the company has increased its share-repurchase authorization by 50 percent to $3.0 billion, which is equivalent to 9 percent of Devon’s market capitalization. This expanded authorization extends through the end of 2024.
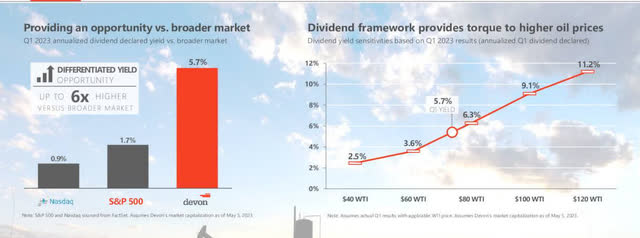
The company now pays fixed and variable dividends based on free cash flow. The dividend consists of two parts:
- A fixed quarterly dividend of $0.20 per share.
- A variable payment ($0.52) based on excess free cash flow multiplied by a payout ratio determined by the board as high as 50%.
The total quarterly dividend was $0.72 per share or a yield of ~5.9%, which is still high for such an E&P operator, albeit lower than the preceding quarters.
DVN repurchased $692 million of shares Year to Date.
DVN Dividend Presentation (DVN Presentation)
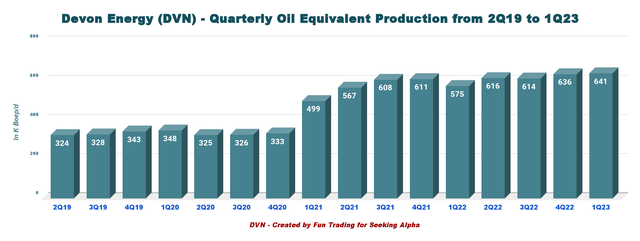
3 – Quarterly Production: Production was 640.7K Boep/d in 1Q23
DVN Quarterly Production History (Fun Trading)
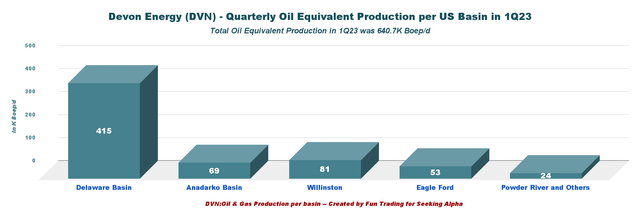
Devon Energy produced 640.7K Boep/d in the first quarter, 11.5% higher than the 1Q22. The Delaware Basin produced 414.7K Boep/d in 1Q23.
Natural gas liquids production increased 13.7% year-over-year to 171.7K Boep/d. Oil production averaged 320K Boep/d, up 11.1%.
U.S. Production repartition for the five prominent locations is as follows:
DVN 1Q23 Quarterly Production per Basin (Fun Trading)
The Delaware Basin is the number one producing asset for Devon Energy, representing 64.7% of the total production, and the Liquids (Oil + NGL) 73.2% of the total output.
DVN 1Q23 Quarterly Production Oil, NGL, NG (Fun Trading)
Total oil equivalent realized prices, including cash settlements, were $46.66 per Boe, and NG was $2.29 per Mcf. Below are the historical prices realized for Boe and NG.

DVN Quarterly Oil and Gas Prices Realized History (Fun Trading)
- Realized oil prices for the second quarter were $74.22 per barrel from $81.62 in the year-ago period.
- Realized prices for natural gas liquids were up to $24.12 per barrel from $37.76 in the prior-year quarter.
- Realized gas prices were up to $2.29 per thousand cubic feet from $3.77 in the prior-year quarter.
4 – 2023 Guidance
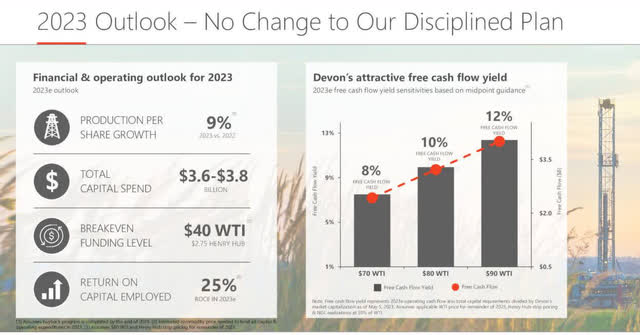
Production is expected to increase, and CapEx 2023 is between $3.6 and $3.8 billion.
DVN 2023 Outlook (DVN Presentation)
5 – Debt situation, liquidity
DVN Quarterly Cash versus Debt History (Fun Trading)
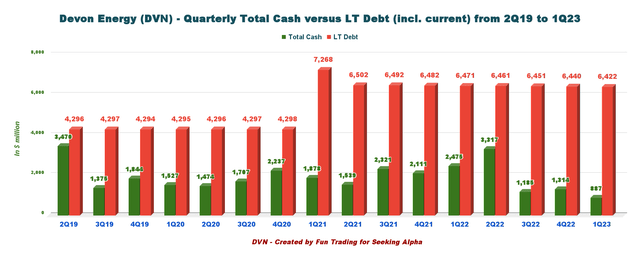
As of March 31, 2023, the company had cash and cash equivalents, including restricted cash, of $887 million, down from $2,475 million on March 31, 2022. Net Debt is now 5,535 million, up significantly from $3,996 million in 1Q22.
This is a weakness that I have complained about for many quarters. The dividend and buyback policy is unsustainable, and the flaw can be seen in the debt history. I think the best strategy for DVN is to slowly reduce its debt before using its precious cash flow to buy back shares.
Devon Energy exited the first quarter with $3.9 billion of liquidity. About 60% of the outstanding debt obligations mature after 2030.
Long-term debt amounted to $6,440 million, down from $6,482 million on December 31, 2021.
Devon Energy’s net cash from operating activities for the first quarter of 2023 was $1,677 million compared with $1,837 million in the year-ago period.
The net debt is now $6.42 billion, with a net debt-to-EBITDAX of 0.6x.
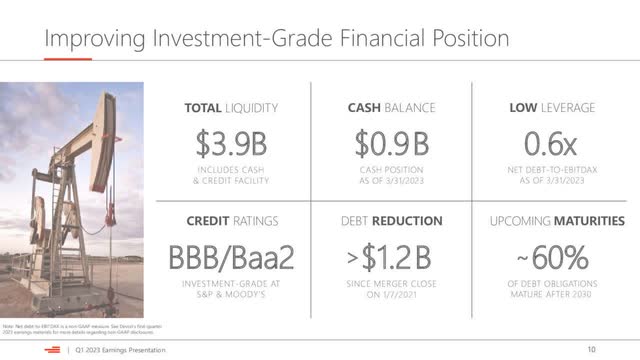
DVN Balance Sheet (DVN Presentation)
Technical Analysis and Commentary
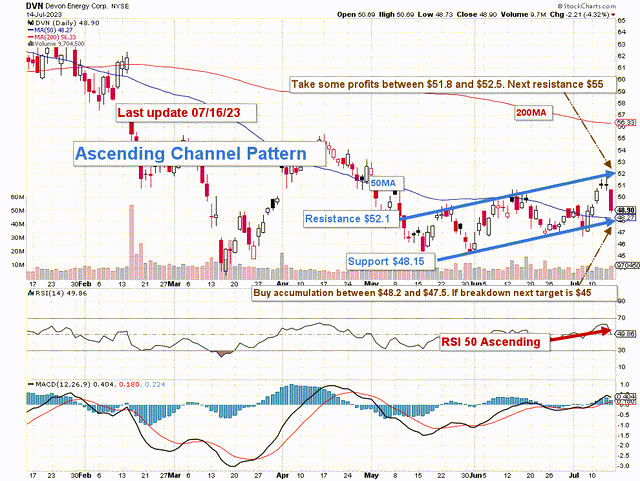
DVN TA Chart (Fun Trading StockCharts)
Note: The chart is adjusted from the dividend.
DVN forms an ascending channel pattern with resistance at $52.1 and support at $48.15.
Ascending channel patterns or rising channels are short-term bullish in that a stock moves higher within an ascending channel, but these patterns often form within longer-term downtrends as continuation patterns. The ascending channel pattern is often followed by lower prices.
The short-term trading strategy is to trade LIFO about 35%-45% of your position (depending on your cash available) and keep a core long-term position for a much higher payday. I suggest selling between $51.8 and $52.5 with higher resistance at $55 and waiting for a retracement between $48.2 and $47.5 with potential lower support at $45.
Warning: The TA chart must be updated frequently to be relevant. It is what I am doing in my stock tracker. The chart above has a possible validity of about a week. Remember, the TA chart is a tool only to help you adopt the right strategy. It is not a way to “know” the future. No one and nothing can.


