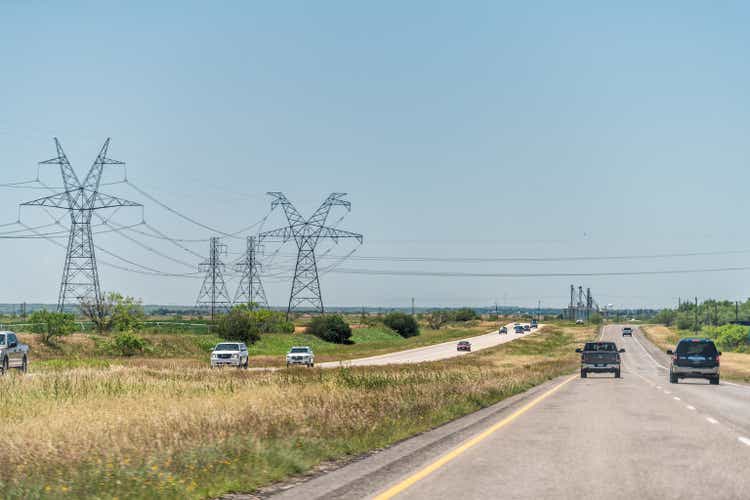
Power transmission lines in North Central Texas
krblokhin/iStock Editorial via Getty Images
Investment Thesis
Texas is the largest electricity market in the United States, both producing and consuming more electricity than any other state. Record demand in June 2023 was well over 80 GWs. It also ranks #1 in wind power, and #2 in solar power.
For an investor interested in participating in this market, or perhaps the Texas economy more generally, we identify eight publicly investor owned utilities with operations in Texas.
CenterPoint Energy, Inc. (NYSE:CNP) provides the most concentrated Texas focus among utilities in our preferred transmission and distribution segment of the deregulated Texas market.
Introduction
In this article we will recap some basic facts about Texas that impact the demand, supply, and delivery of electricity, how the electricity market in Texas is regulated, current power generation mix, how the market is organized, and significant players in the market. We offer an analysis of the candidates and our choice, some thoughts on valuation, and conclude with a summary investor takeaway.
Companies discussed include:
- American Electric Power, Inc. (NASDAQ:AEP).
- Calpine (private).
- CenterPoint Energy, Inc.
- Entergy (NYSE:ETR).
- NRG Energy, Inc. (NYSE:NRG).
- PNM Resources, Inc. (NYSE:PNM).
- Sempra Energy (NYSE:SRE).
- Vistra Corp (NYSE:VST).
- Xcel Energy Inc. (NYSE:XEL).
and their operating subsidiaries.
The Electricity Market in Texas
We summarize some basic facts about Texas, and then discuss how the market is organized and managed.
Texas
Electricity demand is largely driven by population and industry.
Population
Texas ranks #2 in population among U.S. states, with an estimated population of 30.5 million people in 2023.
The population in Texas has grown dramatically in recent years. The U.S. Census reports that the 43.4% increase in Texas from 2000 to 2022 was the 4th fastest among the 50 states, with Texas adding 9.1 million new residents, more than any other state. The Texas Geographic Center projects a population of ~ 47 million by 2050, another 16 million people.
The population increase is concentrated in a few dozen counties in and around the Houston, San Antonio, Dallas-Ft. Worth, and Austin metro areas. Many of those rank among the fastest-growing counties in the U.S. Harris County (the core of Houston) for example added 1.3 million people during that period.
Industry
Texas ranks #1 in Fortune 500 headquarters with 55, primarily in Houston (26) and Dallas (24). Texas ranks #1 in exports, #2 in manufacturing, with Houston the #1 city in the U.S. for manufacturing jobs.
Texas also consumed more energy than any other state, with the industrial sector accounting for more than half of total energy consumption in Texas, and 23% of the total U.S. industrial sector energy use (not all of this was electricity).
Energy Production
According to the Energy Information Agency, in 2022 Texas produced more oil, more natural gas, more electric power, and more electricity generated from wind than any other state. Texas is also #1 in the number (32) and capacity of refineries.
Leadership in electricity generation from wind is long-standing; Texas has ranked #1 for 17 consecutive years.
The Solar Energy Industries Association reports that in Q1 2023 Texas ranks #2 in installed solar capacity with 18.2 GW, and #1 in projected growth over the next five years with 40.8 GW.
The image below from the most recent EIA Monthly Report shows projected new generating capacity coming online over the next year illustrating the rapid growth of capacity going on in Texas.
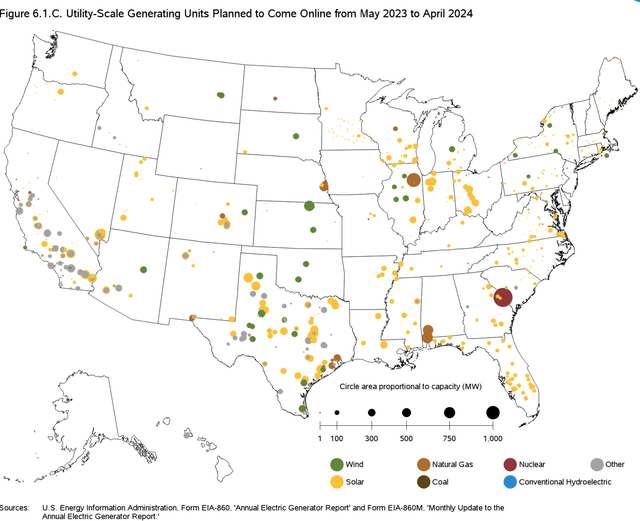
New Capacity Planned (EIA)
Per the EIA, in April 2023, Texas accounted for 26.5% of total U.S. energy production from wind, and 12.2% of total U.S. energy production from PV solar.
Price of Electricity
The price of electricity in Texas is 10-15% below the U.S. average, and markedly below some states, attracting both people and industry.
The Energy Information Agency (EIA) publishes data on actual prices by state. The table below shows a sample of several large states, and includes the lowest and highest cost states for consumers to show the range of prices.
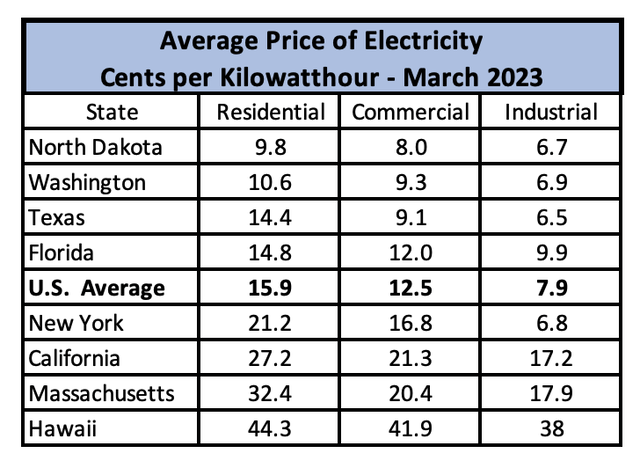
Electricity Prices By State (EIA data, table by author)
Geography
There are three points to mention here that impact the electricity market – physical size, wind potential, and solar potential.
Texas is big, ~ 750 x 750 miles North to South and East to West. These distances have implications for the electrical grid; e.g., it’s about 500 miles from Houston, the largest city, to the wind farms around Lubbock, and a similar distance to the prime solar areas in West Texas.
Texas sits in the Great Plains wind fairway. As they say, with only a little poetic exaggeration, “there’s nothing between the North Pole and Lubbock but a barbed wire fence.”
The U.S. Geological Survey supports a Wind Turbine Database which includes a mapping interface, which captures the concentration of wind farms in the north central Texas. There is also a smaller concentration along the coast near Corpus Christi.
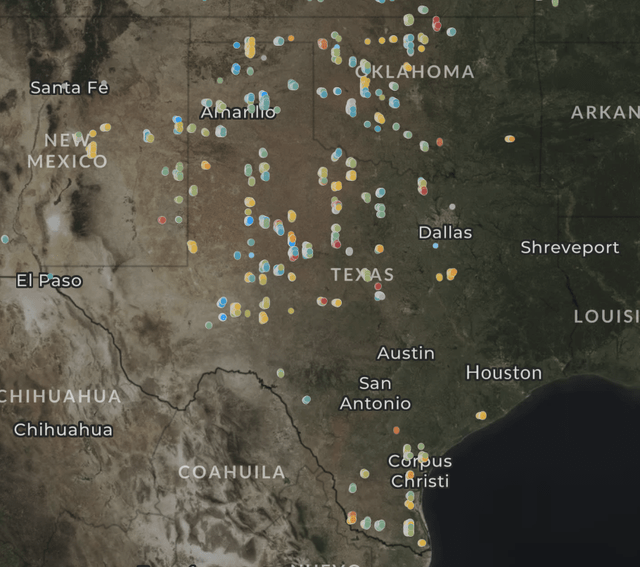
Wind Farms in Texas (U.S. Geological Survey Wind Turbine Database)
Texas has considerable solar potential, strongest in West Texas and less in the East. The National Renewable Energy Laboratory (NERL) provides useful solar irradiance (i.e., energy) maps. The map below shows the annual average values, which illustrate the considerable (~ 50%) gradient from West to East in Texas.
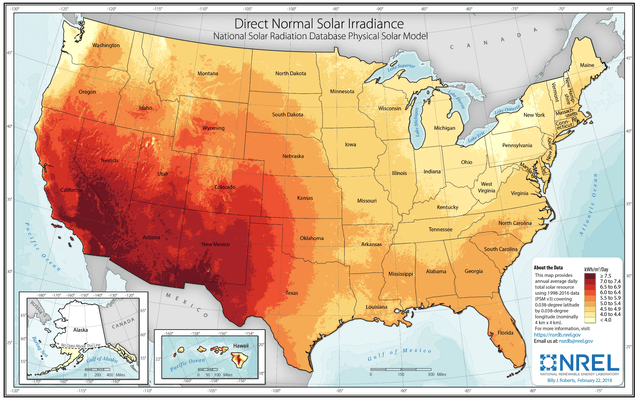
Solar Potential in Texas (NREL )
At the same site, NREL also provides maps by month, which illustrate the very considerable seasonal variation.
Regulatory Framework
The relevant regulatory bodies here are the Public Utility Commission of Texas (PUCT) and the Electric Reliability Council of Texas (ERCOT), and to a lesser degree the Federal Energy Regulatory Commission (FERC).
The Texas Legislature established a competitive electric wholesale market in 1995, and in 1999 extended this to establish in most areas of Texas a competitive choice-based retail electric market. The is usually termed a deregulated market.
In this deregulated market, power is generated by merchant generators, marketed and sold to household, commercial, and industrial customers by a Retail Electrical Provider (REP), and physically delivered by a Transmission and Distribution Utility (TDU). Some TDUs provide only transmission services, and have no retail customers.
Texas chose to retain a number of existing municipally owned utilities (MOU) and Cooperatives outside the deregulated market. These act largely as traditional vertically integrated utilities.
There are also a handful of regulated investor owned utilities (IOU) that provided traditional vertically integrated service.
These various types of service providers are discussed in more detail below.
Public Utility Commission
Founded in 1975, the PUCT regulates all of the state’s electric utilities.
As one example, electrical power generation and delivery was impacted by extreme cold weather 15-19 February 2021 (Winter Storm URI), see page 9, PUCT January 2023 Biennial Agency Report.
As a result of that experience, and subsequent legislation, the PUCT has taken number of actions to improve grid reliability and resilience.
Electricity Reliability Council
The Electric Reliability Council of Texas (ERCOT) is a membership-based 501(c)(4) nonprofit corporation, subject to oversight by PUCT and the Texas Legislature.
It is often the public face of the electric grid in Texas, although it neither produces, sells, or delivers electricity. Although the ERCOT footprint covers only about 90% of the population and electrical load in the state, Texas and ERCOT are often used interchangeably, e.g., this recent Seeking Alpha report on record electricity demand. See some key metrics here.
ERCOT is one of 10 regional independent system operators (ISO) which manage the U.S. electrical grid. These organization generally facilitate and manage wholesale grid open access, markets, and reliability. The regional organizations are described here.
ERCOT is unique in that it operates wholly within the state of Texas, and is – by intent – not generally directly connected to or integrated with other states.
The ERCOT footprint in blue in the map below.The grey areas in the map fall outside ERCOT, and under other multi-state ISOs, essentially similar to ERCOT. The two sections in the panhandle region fall under the Southwest Power Pool (SPP). The section in East Texas falls under the Midcontinent Independent System Operator (MISO). The section in far West Texas fall under the Western Electric Coordinating Council (WECC).
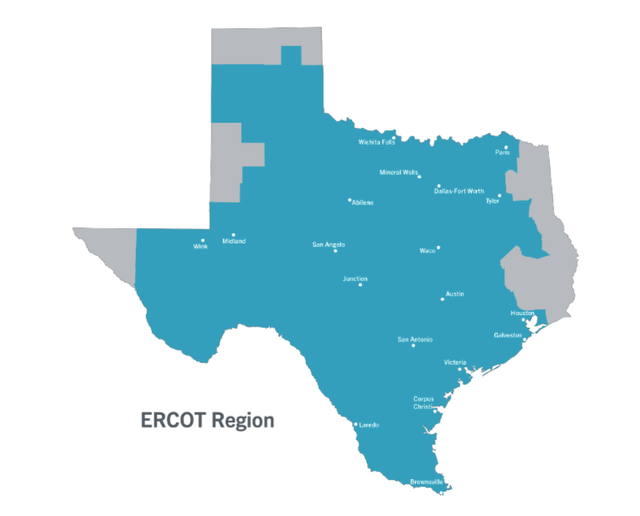
ERCOT Footprint (PUCT Biennial Report 2023)
Power Generation
Texas ranks #1 in electric power generation. This EIA data is for March 2023.
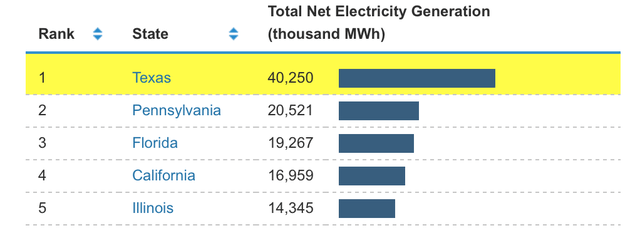
Electric Power Generation by State – March 2023 (EIA)
It’s worth noting that Texas generates all the power it uses. In contrast, California imports a very substantial amount of the power they use.
The graphic below from ERCOT shows the actual sources for electricity in 2022 and the installed capacity in 2023. ERCOT summer 2023 maximum capacity about 98,000 MW.
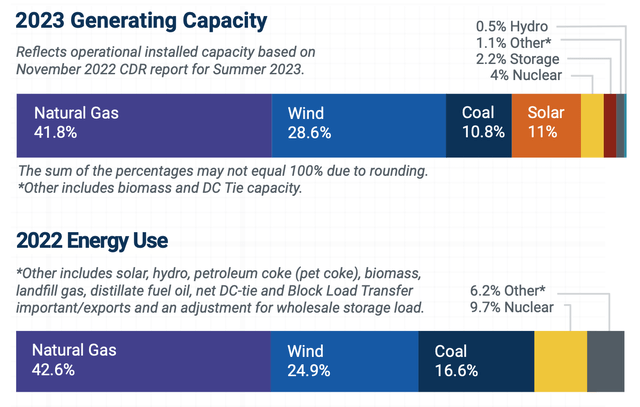
ERCOT 2022 Sources and 2023 Capacity (ERCOT)
The EIA provides a map of energy infrastructure. The two maps below show the locations of natural gas and wind and solar generation facilities. As one might expect, natural gas plants are clustered around population centers.
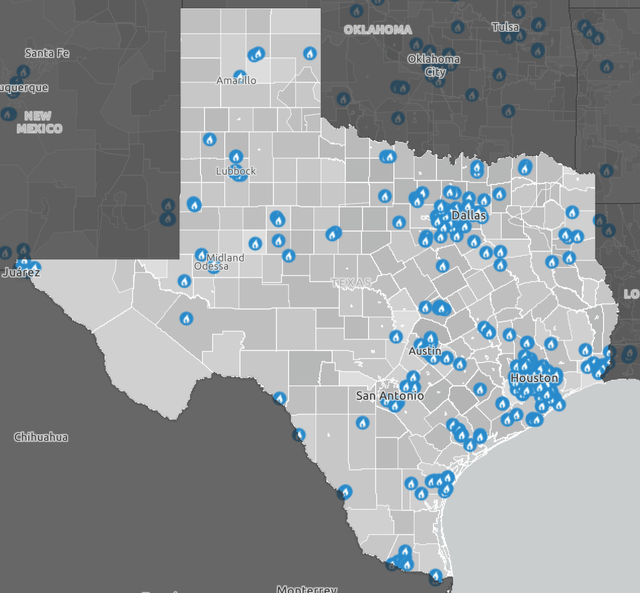
Natural Gas Power Plants in Texas (EIA)
Wind farms in contrast are concentrated in the central Texas plains, and along the south coast near Corpus Christi – generally not near the larger population centers.
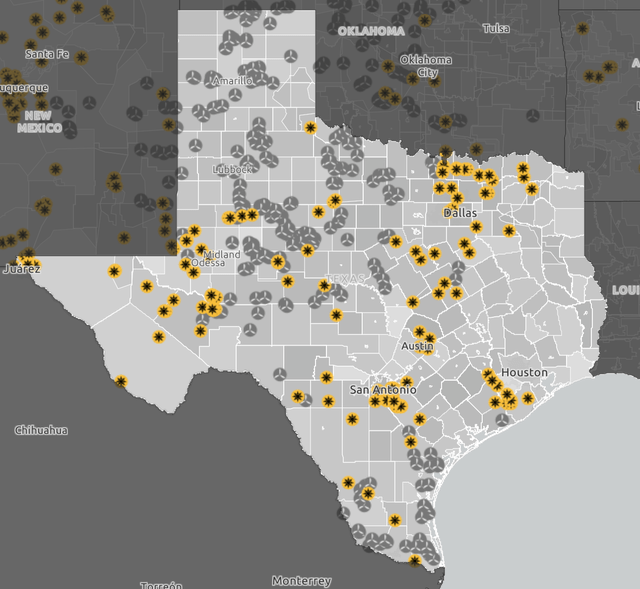
Wind and Solar Farms in Texas (EIA)
How the Market is Organized
Further details on the companies mentioned in this section will be provided in the next section.
Retail Electricity Provider (REP)
REPs buy wholesale electricity from generators and sell to retail customers. About 6.9 million residential, 1.2 million commercial, and 4,800 industrial customers buy power from REPs.
There are about 140 Retail Electric Providers registered with the PUCT. A utility might own multiple REPs, which essentially function as brands. The two largest REP brands TXU Energy (owned by Vistra) and Reliant Energy (owned by NRG).
Market concentration is larger than it might initially appear. Market share information does not appear to be readily available, but this Oct 2020 Electricity Journal paper estimates the 2019 market share as 32% NRG Energy with the acquisition of Direct Energy), 21% Vistra Corp., and 8% Calpine. Concentration in the residential center was higher; 46% NRG Energy and 32% Vistra Corp., e.g. ~ 75% for these two firms.
Transmission and Distribution Utility (TDU)
In the deregulated areas served by REPs, a separate Transmission and Distribution Utility [TDU] owns the wires and transformers, and actually delivers electricity. The map below shows the footprint of the five major TDUs in ERCOT.
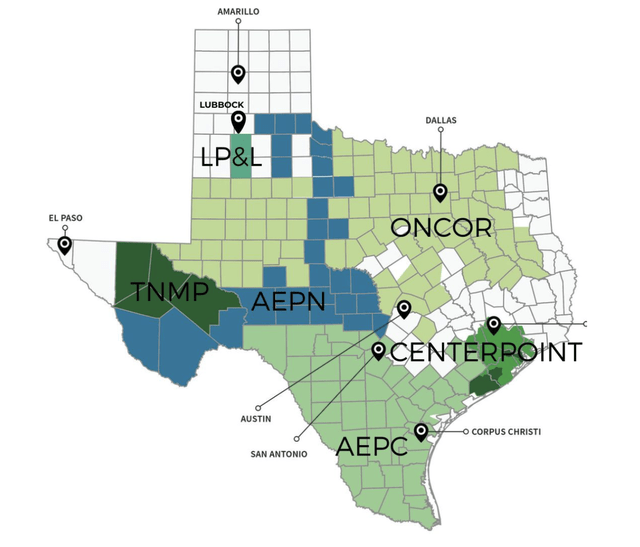
ERCOT TDU Service Areas (Quick Electricity )
The best systematic count of physical delivery customers I found is provided by the very useful poweroutage.us website, which collects and reports data on customers in all 50 states. The table below lists the 15 provides with more than 100K customers in Texas, which account for 88% of total customers.
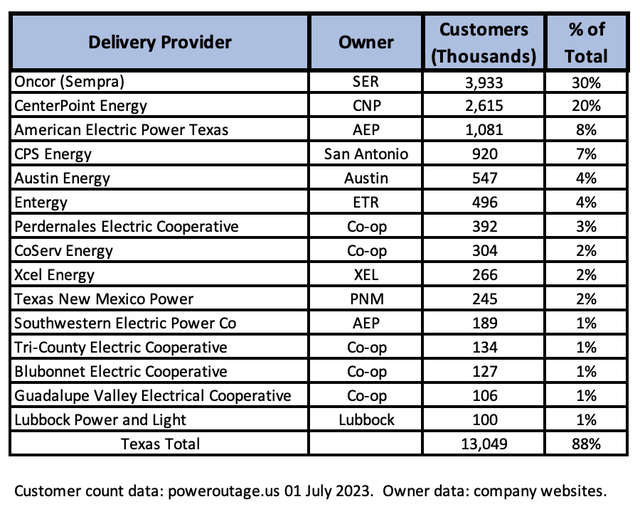
Electricity Customer Count (poweroutage.us)
Cooperatives and Municipal Utilities
In the ERCOT footprint, there are 75 member-owned electric cooperatives, and 72 municipally owned and operated utilities (MOU), serving 4.7 million homes and businesses. Typically vertically integrated, MOU’s can be large; they include CPS Energy (920,000 customers) in San Antonio and Austin Energy (about 550,000).
In September 2023, the Lubbock Power and Light (LP&L) MOU with 108,000 customers will convert to retail electrical competition, and LP&L will become a TDU. This is the first MOU to opt into the competitive retail electrical market.
PUCT sets the wholesale transmission rates of MOUs and electric cooperatives in ERCOT and regulates reliability issues, but does not set their retail rates.
Integrated Utilities
Outside of the ERCOT footprint, four investor-owned utilities (IOU) provide power to about 1.2 million customers (the grey areas on the map in the ERCOT section above). These are all vertically integrated with interstate footprints.
Those utilities are El Paso Electric Company (private – purchased by Infrastructure investment Fund in July 2020), Southwestern Public Service Company (owned by XEL), Southwestern Electric Power Company (owned by AEP), and Entergy Texas, Inc. (owned by ETR).
The PUCT sets retail rates these utilities. These utilities have a geographic monopoly in their respective areas of operation – consumers served by these utilities do not have a choice of provider.
Regularity authority involving the operation of those interstate utilities in Texas is shared between PUCT and FERC.
The Players
We can now turn our attention to the significant players in the Texas market. We identify nine.
NRG
NRG Energy, Inc. (NRG). NRG generates and markets electricity, and market natural gas. NRG agreed in June 2023 to sell its 44% interest in 2.5 GW South Texas Nuclear project, its only nuclear power plant capacity. After this sale, NRG will have about 13 GW of wholesale generating capacity, with 69% of this capacity in Texas in 2023.
NRG is the largest retail electricity provider in Texas, through the Reliant Energy, Direct Energy, Cirro Energy, Green Mountain Energy, Discount Power, Xoom Energy, CPL, Stream Energy, and First Choice Power brands.
See their June 2023 Investor Day Presentation.
Vistra
Vistra Corp (VST) through its subsidiary Luminant has 36 GW total generation capacity in 12 states, with 17 GW in Texas, including the 2.4 GW Comanche Peak nuclear plant. Announced in March 2023, the acquisition of Energy Harbor with 4 GW of nuclear capacity will leave VST a solid #2 in merchant nuclear power. Post acquisition 41% of total generation capacity will be in Texas.
VST is second largest retail electricity provider in Texas, most familiar through TXU Energy, Ambit Energy, TriEagle Energy.
See Q1 2023 Earnings Call Presentation here.
Calpine
Calpine (private) provides 26 GW of generating capacity, with operations in 22 states, Canada, and Mexico. About 9 GW of its generation capacity (35%) is in Texas.
Calpine is a retail electric provider in Texas, probably 3rd in market share, with a focus on industrial customers.
Sempra Energy
Sempra Energy (SRE) is a very large utility with operations in California (SDG&E and SoCal Gas) and Texas. Sempra Infrastructure owns assets in the U.S. and Mexico.
Sempra Texas Utilities owns 80.25% of Oncor Electric Delivery Company LLC, and a 50% interest in Sharyland Utilities, both regulated electricity transmission and distribution businesses. Sharyland owns 64 miles of transmission lines. Sempra Texas contributed about 35% of SRE earnings in 2022.
Oncor is the largest TDU in Texas, serving 3.9 million customers, with 18,268 circuit miles of transmission lines, 124,000 miles of distribution lines, 1,207 transmission and distribution substations. It provides interconnection to 146 third-party generation facilities totaling 48,430 MW.
The map below shows Oncor’s footprint. The Dallas – Ft. Worth metro is the center of gravity for Oncor, with a service area that includes 400 cities and towns.
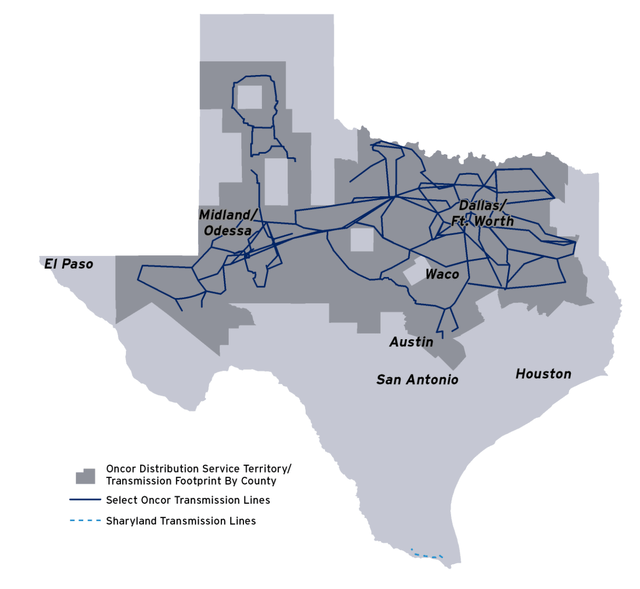
Sempra Texas Oncor Footprint (Sempra 2022 Annual Report)
Sempra acquired Oncor in 2018, paying $9.5 billion for 80% interest, outbidding Warren Buffett. Sempra’s relation to Oncor is unusual; it owns but does not control Oncor, with what are usually described as “ring fencing” provisions in place to ensure Oncor’s customers are not adversely impacted by Sempra’s other businesses. See the 2022 Annual Report for a more complete description.
American Electric Power
American Electric Power, Inc. (AEP) is a very large utility with operations in 11 states, serving 5.6 million customers. AEP is the largest transmission provider in the U.S., with 40,000 miles of transmission lines. Capital investment is focused on wires (65%) and regulated renewables (22%).
See their 2022 10-K here, and their Q1 2023 Earnings Call Presentation here.
Two AEP operating companies operate in Texas: AEP Texas and SWEPCo. In 2022, AEP Texas contributes 14.2% of pre-tax income, and SWEPCo 10.1%.
AEP Texas provides transmission and distribution of electric power to ~ 1.1 million retail customers through REPs in west, central and southern Texas, via 46 thousand miles of transmission and distribution lines. AEP Texas is a member of ERCOT.
SWEPCo provides generation, transmission and distribution of electric power to approximately 551,000 retail customers in northeastern and panhandle of Texas, Louisiana and Arkansas. It also provides wholesale electric power to other electric utility companies, municipalities, rural electric cooperatives and other market participants. SWEPCo owns 5.6 GWs of generating capacity, and has 26,000 miles of transmission and distribution lines.
SWEPCo is a member of SPP.
CenterPoint
CenterPoint Energy, Inc. (CNP) is a mid-sized utility with electricity operations in Texas (95% of customers, about 88% or revenue) and Indiana (5%), and gas utility operations serving 4.3 million residential and commercial customers in Texas (44% of customers) and five other states. A footprint map is available here. Electricity accounts for about 44% of revenue and 55% of net. Texas electric operations generate ~ 50% of net, combined electric and gas generates ~ 70% of net.
CNP’s electricity business in Texas, CenterPoint Energy Houston Electric, LLC., is solely a TDU. Operating in the in the Houston metro area, with 3,900 miles of transmission lines, 29,000 miles of distribution lines, and 239 substations, it delivers electricity to 2.7 million customers. The map below clearly delineates the service area, which includes the fast-growing areas to the West and Southwest of Houston.
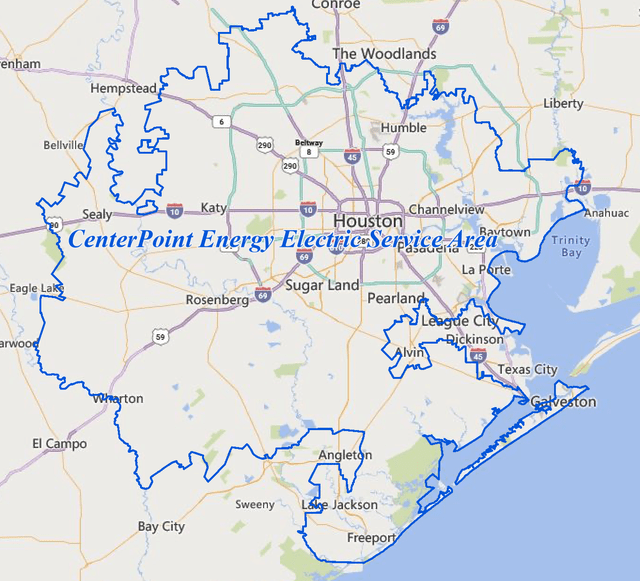
CNP Electric Texas Service Area (CNP)
Houston Electric is a member of ERCOT. Indiana Electric is a member of MISO.
See 2022 Annual Report here. In 2020 I wrote a CNP overview and an update in 2020; they have since made significant progress toward their goal of becoming a premium pure-play regulated utility.
Entergy
Entergy Corporation (ETR) is a large utility with operations in East Texas, Louisiana, Mississippi, and Arkansas, in the Mid-Continent System Operator (MISO) area. The Texas operating company, Entergy Texas, has 500,000 customers in 27 Texas counties and accounts for 18% of electricity revenue. See their Q1 2023 Earning Call Presentation here.
Xcel Energy
Xcel Energy Inc. (XEL) is a large electric and gas utility with operations in 8 states, including 3.7 million electricity customers. Operating as Southwestern Public Service Company (SPS), it provides electric service in Texas and New Mexico, with 5.2 GW of generation capacity and 400,000 electric customers, of which about 270,000 are in Texas. SPS accounts for about 17% of Xcel rate base and 12% of revenue; Texas is < 10% of revenue.
See their Q1 2023 Earnings Call Presentation here.
PNM Resources Inc.
PNM Resources, Inc. (PNM), operating as Texas-New Mexico Power Company (TNMP), provides transmission and distribution services for 270,000 customers oddly scattered across Texas (see service area map).
PNM agreed in October 2020 to merge with Avangrid (NYSE:AGR). The merger approval process is still underway, and the two companies announced on 20 June to extend the agreement until 31 December 2023.
Others
A considerable amount of the electricity generation and distribution business is not available to individual retail investors. The PUCT maintains a list of the very large number of generation and much smaller number of transmission entities. A small sample:
Wind Energy Transmission Texas, LLC
Wind Energy Transmission Texas, LLC owns “390 route miles/515 circuit miles of 345-kV transmission lines, 9.7 route miles of 138-kV lines, and 11 substations, in 12 counties” connecting 1200 MW of wind generation and 250 MW of solar generation. One of 14 investor-owned utilities, they are privately owned, and partnered with Axiom Infrastructure.
Cross Texas Transmission, LLC
Cross Texas Transmission, LLC. provides high-voltage transmission services. It is a subsidiary of LPS Power Grid, which is a subsidiary of LS Power, a private investment firm.
Electric Transmission Texas, LLC
Electric Transmission Texas LLC is a joint venture between AEP and Berkshire Hathaway Energy Company (BHE). It provides high-voltage transmission only, and connects over a dozen wind and solar sources to the grid.
Analysis
Overweight Utilities?
To recap, our investment thesis is that we want to be overweight in utilities in general and Texas utilities in particular. I assess this from the perspective of a long-term buy and hold investor, where utilities are intended to provide a relatively low-risk portfolio component.
The Vanguard Total Stock Market ETF (VTI) has a 3% weighting for utilities. The first utility is 0.19% and holding #97. The Vanguard Utilities Index Fund ETF (VPU) is a low cost (0.1%) indexed option holding 65 utilities and currently yielding 3.24%. Among the candidates we identified above, SRE, AEP, and XEL fall into the top 10 holdings.
An investor might view these as useful benchmarks. It’s interesting to note that SA’s Quant rating for VTI is Buy, and for VPU is Sell.
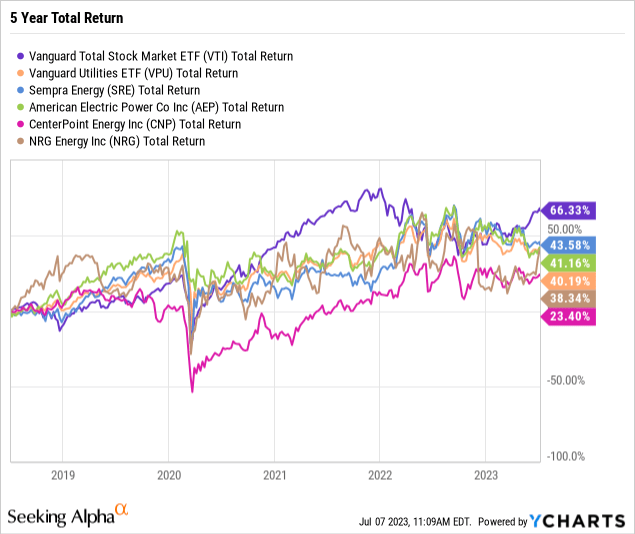
Is it reasonable to consider being overweight utilities? VPU doesn’t do as well as VTI, but utilities aren’t obviously unreasonable. And, with the exception of CNP, the spread among individual utilities isn’t very large.
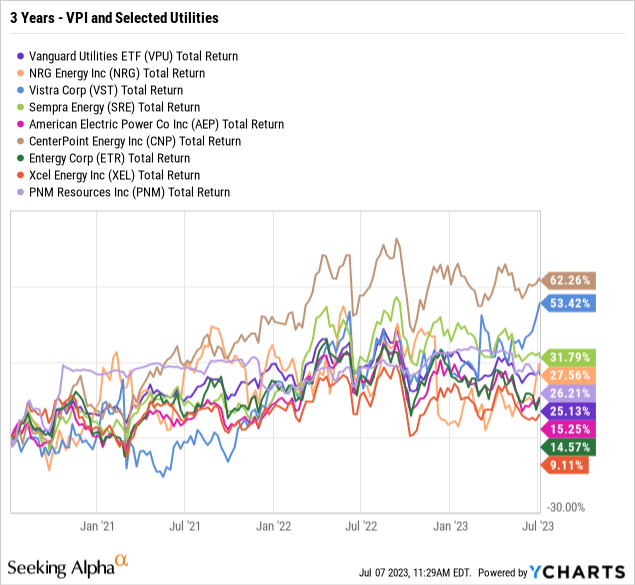
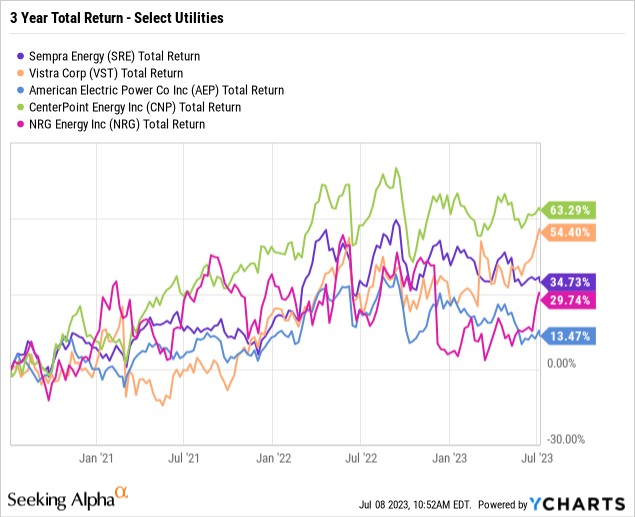
If we look back three years at eight of our nine utilities that are publicly traded, and VPU, we get the chart below; an average return of about 25%. We can also note considerable variance over time.
I’m going to conclude that being overweight utilities is a reasonable choice for at least some investors, and that it may be worth buying individual utilities.
It’s worth noting that in the above charts, CNP had the worst performance over 5 years, and the best over 3 years (there was a change in strategic direction and management, and a significant dividend cut in 2020). While utilities generally evoke an expectation of slow change, there are now enough acquisitions, divestitures, and strategy changes in the industry that I’m going to use 3 years for the rest of this analysis. It also serves as a reminder to investors that due diligence is required.
Caution – Very Large Investments Ahead
Although a detailed discussion is outside the scope of this article, it is worth recalling the social and political aspirations to eliminate the generation of electricity from coal (17% in Texas 2022), and eventually natural gas (43%). The electrification of transportation and potentially other sectors of the economy would add substantial new demand.
Texas has two nuclear power facilities, one near Dallas, one near Houston; they produced about 10% of Texas power in 2022. There are no current plans for additional conventional nuclear. Texas has essentially no grid relevant hydroelectric or pumped storage capacity or potential.
Capacity factor captures the difference between actual production vs. design or nameplate capacity, and varies considerably by source. The EIA reports the 2022 capacity factor numbers for the U.S.: hydroelectric 37%, nuclear 93%, gas 62%, PV solar 25%, wind 36%. Wind and solar are significantly seasonal, with wind varying by month from 24-47%, and solar from 13-33%. Wind and solar also vary from hour-to-hour and day-to-day. Every GW of coal or gas retired will require significantly more than a GW of wind or solar replacement.
Data from California reported here suggests their solar time of day production vs. demand mismatch is worsening, but storage will eventually (by 2038) provide a solution.
Regardless of the pace of the energy transition, Texas will require a huge investment in generation, storage, and transmission facilities. The typical physical distance between generation and demand will likely increase. Utilities – especially those with generation facilities – are likely to be considerably less staid than they used to be.
How to Choose?
My ideal utility investment would be a regulated high-voltage transmission line utility. Transmission offers a simpler business-to-business model, and is less personnel intensive.
My second choice would be a regulated TDU with a purely intrastate footprint in a growing market. A TDU avoids the technical and regulatory issues of negotiating an evolving power generation landscape, and the marketing issues of selling power to consumers. It rewards systematic planning and execution.
Unfortunately, other people have already figured this out, and those ideal assets appear to be unavailable to individual investors or embedded in large utilities with mixed assets.
So what’s available?
Among the nine potential names identified above, we can immediately rule out Calpine as privately owned.
PNM Resources already has a small nexus in Texas; it will be vanishingly small if the merger is completed.
Entergy (~ 18% Texas revenue) and Xcel Energy (~10%) have relatively small footprints in Texas, serving 500,000 in East Texas and 266,000 customers in West Texas respectively. Both service footprint are outside of the major population and growth centers.
That leaves five candidates: SRE, VST, AEP, CNP, NRG. We can look at these five.
Seeking Alpha recently introduced a convenient and comprehensive “Compare” function (see the full report here).
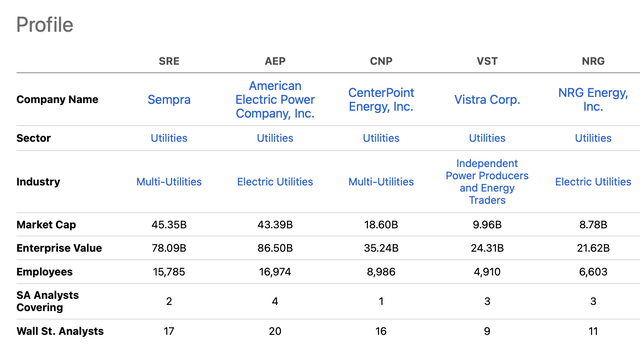
Comparison of Selected Utilities (Seeking Alpha)

Rating of Selected Utilities (Seeking Alpha)
SER, CNP, and AEP are top 3 TDUs in Texas, with about 3.9, 2.6, and 1.3 customers respectively.
NRG and VST are the top retail service providers, with an estimates 32% and 21% market share; residential market share is higher, ~ 46% and 32%.
Based on a preference for TDUs and an objective to invest in the Texas market, I would rate CNP first, with SRE and AEP as alternatives.
I would prefer to see CenterPoint sell their Indiana electric business, and buy additional TDU assets in Texas. The TNMP service areas south and southwest of Houston appear to provide a nearly ideal contiguous bolt on, and would rationalize the TNMP footprint.
CNP Valuation
CNP has a D value rating in Seeking Alpha’s Quant system. The comparison report noted above provides 15 valuation metrics.
Wall Street analysis suggests it is slightly undervalued today.
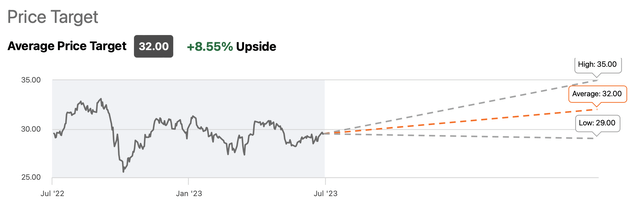
CNP Wall Street Price Target (Seeking Alpha)
With a current nominal yield of 2.58%, dividends have provided a negative real return since mid-2021, perhaps a reason to demand a larger margin of safety, particularly for investors who may be less confident that the Federal Reserve will achieve their inflation reduction goals.
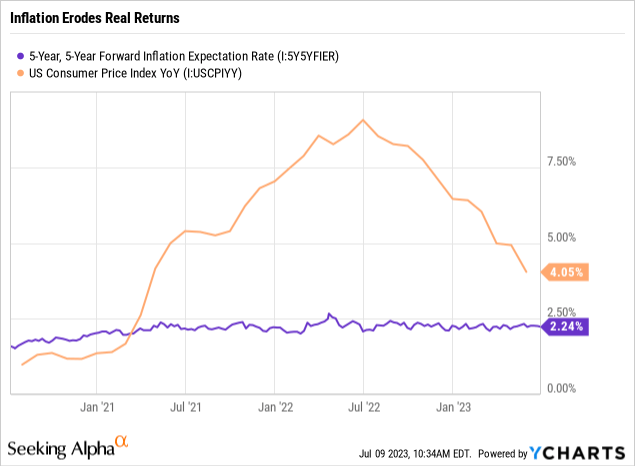
Inflation Impact (Seeking Alpha)
A patient investor might prefer to wait for a larger margin of safety. Price variation suggests they might get it.
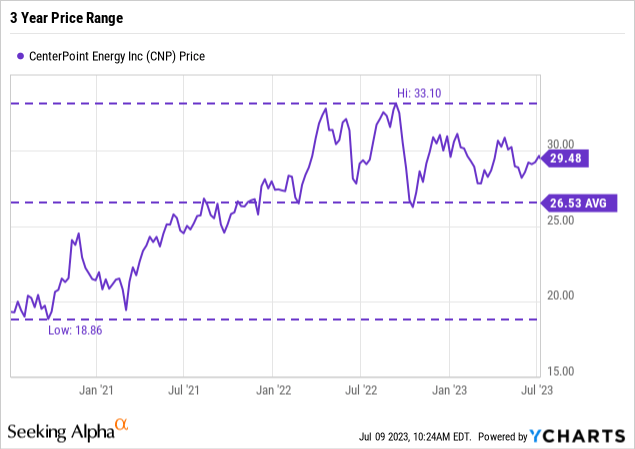
Investor Takeaway
Texas is a very large and growing market for electricity generation, sales, and delivery. Delivery – via a transmission and delivery utility – is in my view the most attractive segment for utility investors seeking stable returns.
CenterPoint Energy is the TDU with the largest and cleanest Texas nexus. New management has done a good job in the last three years focusing on their goal of becoming a premium regulated utility, and projects 6-8% growth going forward. They would be my first choice in this market. Valuation appears about “fair” today, and I would thus rate it as a HOLD under the Seeking Alpha system. A patient investor might well wait for a larger margin of safety.
Investors willing to accept less focus on Texas might find Sempra and American Electric Power – both much larger and more complex utilities but with significant Texas transmission and distribution assets – worth investigation.
Personally, I own a position in CNP, purchase in several tranches in 2015 and 2020. I’m up about 40% plus dividends; a modest success, but then that is almost the definition of a reasonable utility investment. It’s a HOLD for me personally.


