

U.S. storage capacity is below average
After a harsh January, U.S. gas inventories fell to 1,760 Bcf as of February 28, ~11-12% below the 5-year average and ~25% below last year (EIA). Record withdrawals have left inventories 12% below the 2020-2024 norm, leading to tight supplies and higher prices ahead of the spring restocking season.
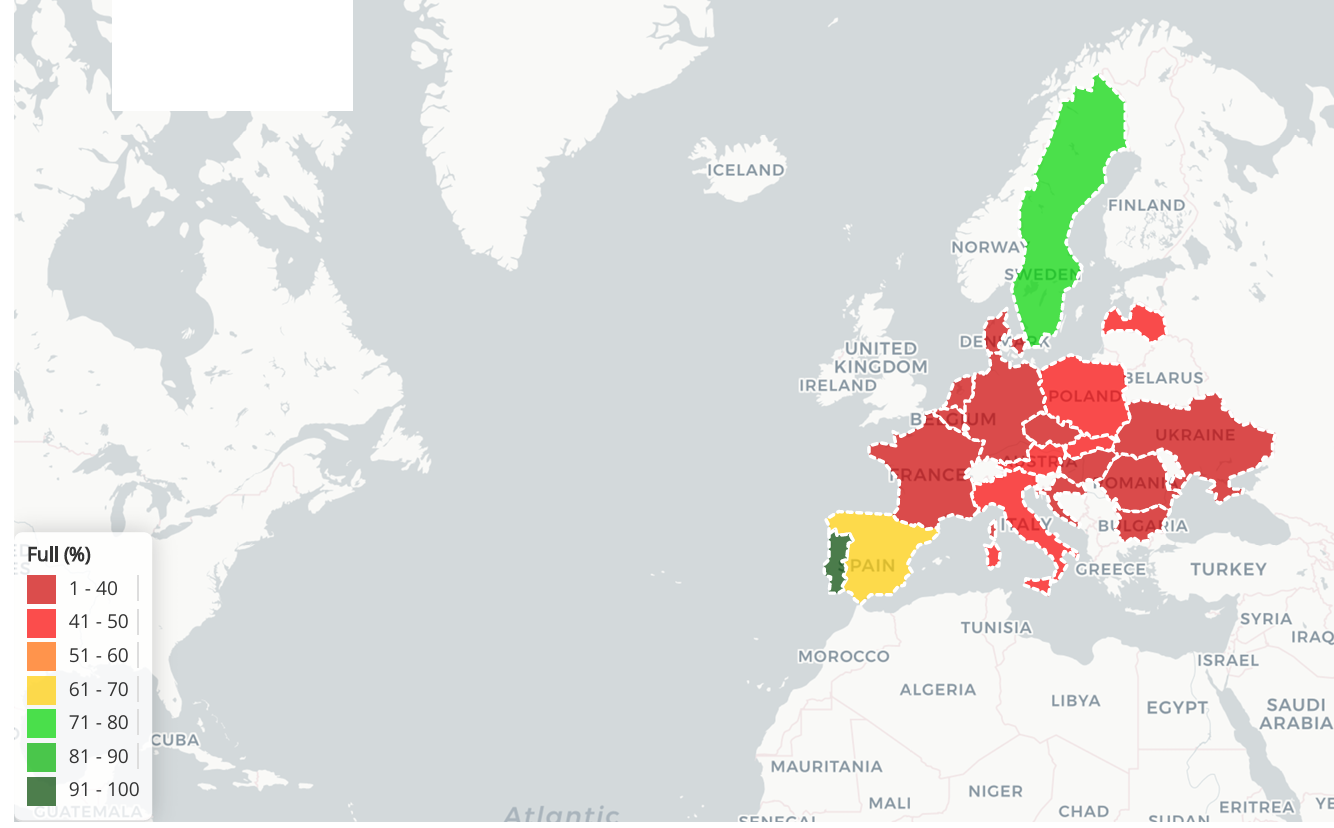
Storage capacity in Europe is well below average
European storage spells a similar trouble: the latest data shows that EU gas reserves are only 38% full, well below last year’s ~62%, and 8% below the 5-year average — storage replenishment goal to reach 90% capacity by November 1 forces European gas operators to buy gas disregarding the price.
How does this affect the price of gas?
Both the U.S. and Europe are coming out of winter with below-average levels of gas in their respective storages, which is definitely driving prices higher. Concerns about depleting inventories have already helped push U.S. Henry Hub gas futures to multi-year highs. In Europe, depleted inventories (coupled with mandatory replenishment targets) have triggered prices to rise to two-year highs in late winter weeks as the market prepares for strong summer replenishment demand. The storage deficiency situation remains a key driver of higher gas prices, signaling that additional supplies will be needed in the coming months to rebuild inventories.
Source: https://agsi.gie.eu/data-visualisation/filling-levels-country/map
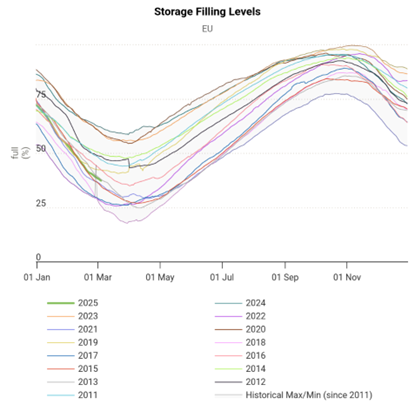
Source: https://agsi.gie.eu/data-visualisation/filling-levels/EU
Low natural gas production in the U.S.
Despite strong demand, U.S. natural gas production remains at record levels (~104-105 Bcf/d in February 2025), posting growth for the first week of March, demonstrating just a slight decrease (~106,2 Bcf/d by the beginning of March ). While freezes have been minimized, pipeline constraints and cautious drilling have limited supply growth.
Major bottlenecks in regions like Appalachia have led to regional price spikes (e.g., $10-20/MMBtu in New York/New England during the February cold snap). Infrastructure constraints mean that even record production can be felt as supply shortages in key markets.
How does this affect the cost of gas?
Because of regulatory uncertainty, production is not growing fast enough to compensate for tight inventories and rising demand. The lack of surplus keeps prices rising.
Tariffs on imports from Canada
On March 4, 2025, the U.S. imposed a 10% tariff on Canadian natural gas, affecting 8-10% of U.S. gas consumption. Immediately after the tariff was imposed, Canadian exports to the U.S. fell from ~9.8 Bcf/d to 8.2 Bcf/d as some shipments were delayed or diverted.
Rising concerns about escalating trade war between the U.S. and Canada have deepened market uncertainty. Some traders altered the existing gas flow channels to minimize the ongoing duties, while Canada was rumored to retaliate by imposing tariffs on U.S. energy exports.
How does this affect the cost of gas?
Reducing Canadian imports directly tightens the supply-demand balance in the U.S. These pipeline imports fill demand from the U.S. Midwest and Northeast consumers; any cut means the U.S. storage or production must fill the gap. News of the U.S. tariffs was also one of the reasons for the recent price rally. In fact, U.S. natural gas futures hit a 2-year high in early March in part due to concerns that Canada would cut energy exports in response to imposed tariffs. The tariffs have made the North American natural gas supply picture a little less certain, supporting prices until the situation becomes clearer.
Expected growth of data centers’ power consumption
Growing power consumption in data centers is slowly but surely increasing the demand for natural gas. In 2023, data centers accounted for ~4.4% of the total U.S. electricity consumption, but this share could reach as much as 6.7-12% by 2028 as AI, cloud computing, and data streaming evolve.
EIA forecasts U.S. electricity demand growth of 2% in 2025, mainly due to the growing data center load. This jump translates into higher gas consumption since natural gas accounts for ~41-43% of U.S. electricity generation. January 2025 even set a winter record for gas flaring in electricity generation.
Large technology and industrial companies are building new natural gas-fired power plants (more than 5 GW planned) to support data center growth, with projects such as a 1.2 GW natural gas power plant in Texas directly connected to a data center. Unlike seasonal heating demand, data centers consume electricity year-round, which increases the underlying demand for natural gas.
How does this affect the cost of gas?
The steady growth of data centers is driving gas demand. This structural shift increases the likelihood of price increases, especially alongside limited storage and high exports.
Reduced weather risks due to the end of winter and polar vortex dynamics
As winter turns to spring, the impact of cold weather on gas prices is waning. In early 2025, the polar vortex had significant disturbances that released Arctic air into the mid-latitudes. In January and again in mid-February, the weakened polar vortex led to cold outbreaks that exceeded temperature norms and drove heating demand to extremes. For the week ending February 22, degree days in the U.S. were about 38% higher than last year and 31% above normal, reflecting the intensity of the sharp cold snap (aga.org ).
These events led to massive gas withdrawal from storage and a dramatic increase in regional gas prices, as discussed above. “Polar vortex distortion” – essentially a distortion or split in the stratospheric polar air mass ‒ is the cause of sudden pipeline freezes. In January 2025, corresponding effects resulted in historic snowfalls in parts of the southern U.S. and record-low temperatures, leading to a surge in residential and commercial gas consumption.
How will this affect the cost of gas?
By March, the influence of the polar vortex phenomenon decreases, the sun inclination angle becomes gradually higher, the days are longer, and even if the polar vortex remains in place, the influx of cold air decreases.
Weather forecasts point to a much milder pattern being established. NOAA’s 6-10 day forecast for early March showed above normal temperatures across large portions of the U.S., especially in the south and east, with no “extreme cold on the horizon” ( aga.org ). Moderate temperatures reduce heating demand; gas companies withdraw less and fewer storage amounts and daily consumption drops. This seasonal pattern turnaround usually causes gas prices to fall or at least limits further weather-induced price spikes.
However, the winter effects wouldn’t disappear overnight. The extreme gas withdrawals the past winter caused the inventories to become low (as detailed in Section 1), affecting the market until production is ramped up and the stocks would return to normal. Moreover, some late season cold weather is still in the forecast for some parts of the country. Meteorologists predict a brief return to below-normal temperatures in some regions in the second half of March. However, such cold spells are expected to be short-lived. Importantly, they will not reach mid-winter frost intensity. As we further move into mid-March, any impacts associated with the polar vortex are rapidly diminishing; the background trend is certainly toward warming. The market is absolutely aware of and prepared for this transition: the tangible weather premium that has been built into gas futures is weakening as each passing week reduces the risk of another Arctic blast.
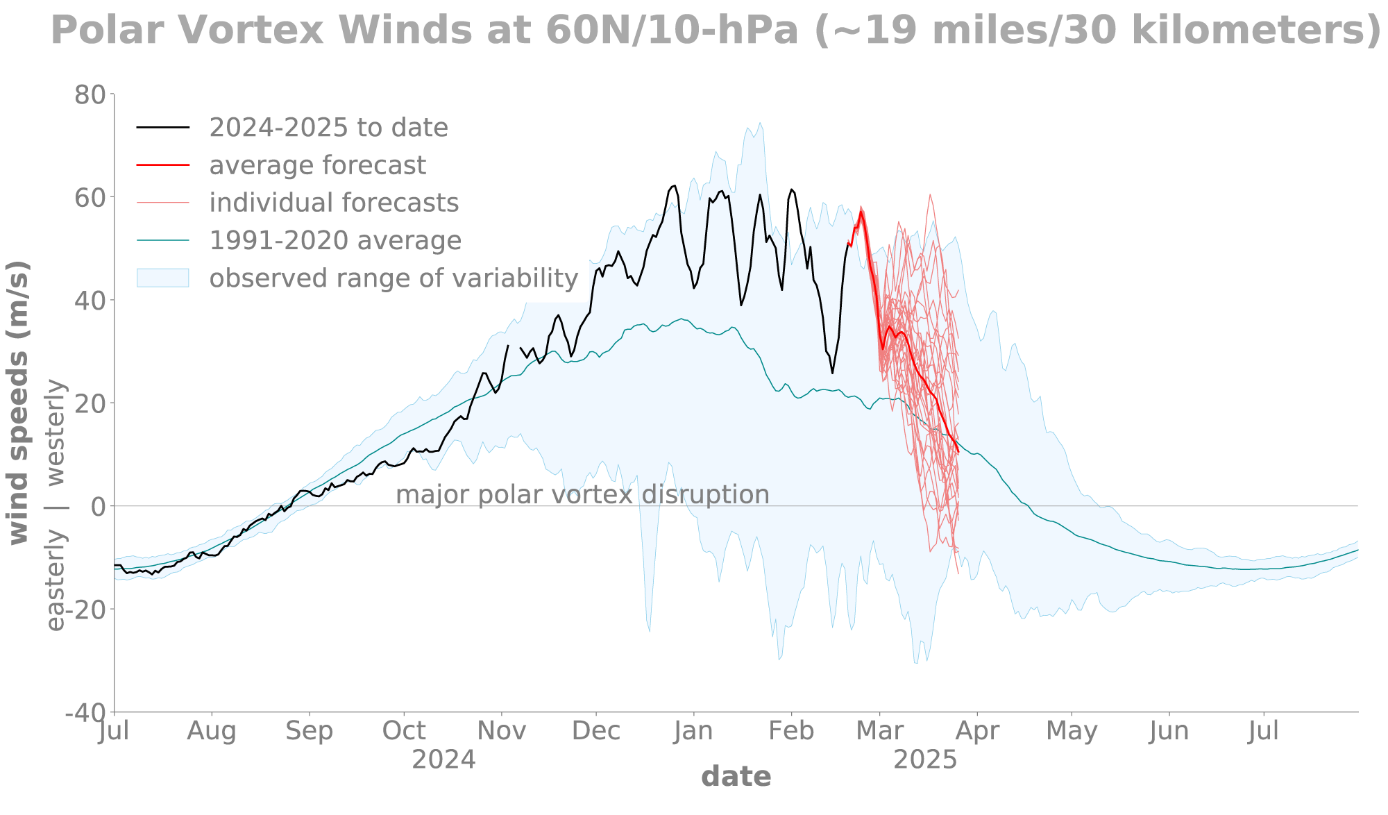
Source: https://www.climate.gov/media/16806
The bottom line here is that we can safely state that the weather factor is already changing from negative (negative for storage, positive for prices) to neutral as the end of the heating season is approaching. The northern atmosphere stabilizes after months of turbulence caused by the polar vortex. However, high demand and tariffs remain primarily at play regarding low gas inventories.