The Renewables and Wholesale Electricity Prices (ReWEP) visualization tool from Berkeley Lab has been updated with nodal electricity pricing and wind and solar generation data through the end of 2023
ReWEP users can explore trends in wholesale electricity prices and their relationship to wind and solar generation. ReWEP includes nodal pricing trends across locations, regions, and different timeframes. The tool consists of maps, time series, and other interactive figures that provide: (1) a general overview of how average pricing, negative price frequency, and extreme high prices vary over time, and (2) a summary of how pricing patterns are related to wind and solar generation. Interactive functionality allows investigation by year, season, time of day, and region, where region is defined as the Independent System Operators (ISO) or Regional Transmission Organizations (RTO) region. ReWEP also contains prices throughout much of the western United States from the Western Energy Imbalance Market and the Western Energy Imbalance Service Market.
New feature – data download
A number of users have requested the option to download the underlying data behind ReWEP. Though a commercial data agreement limits our ability to share all our input data, we have added the option to download much of the aggregated data presented in the figures. To download the data, scroll to the bottom of the ReWEP tool and simply click the download link.
Technical brief about notable trends in 2023
Along with the data update, we published a technical brief that summarizes selected trends about pricing and wind and solar generation from last year.
A preview of the brief follows:
Introduction
Wholesale electricity prices are driven by numerous forces, including a growing amount of wind and solar power. Market forces can include generation costs affected by fuel prices (especially natural gas), or high levels of demand driven by hot weather (such as air conditioning), or tight markets where demand is nearly equal to all available supply. Wind and solar can drive down prices since (1) they can have coincident production in a given area, such as a large wind event across a region; (2) their output can be constrained by inadequate transmission connecting them to load centers, creating localized low or negative prices; and (3) their output can periodically be high relative to load, such as solar power output on cool spring afternoons. By tracking average prices, episodes of very high prices, and the frequency of negative prices, along with wind, solar, and overall electricity demand, ReWEP can be used able to illustrate these dynamics.
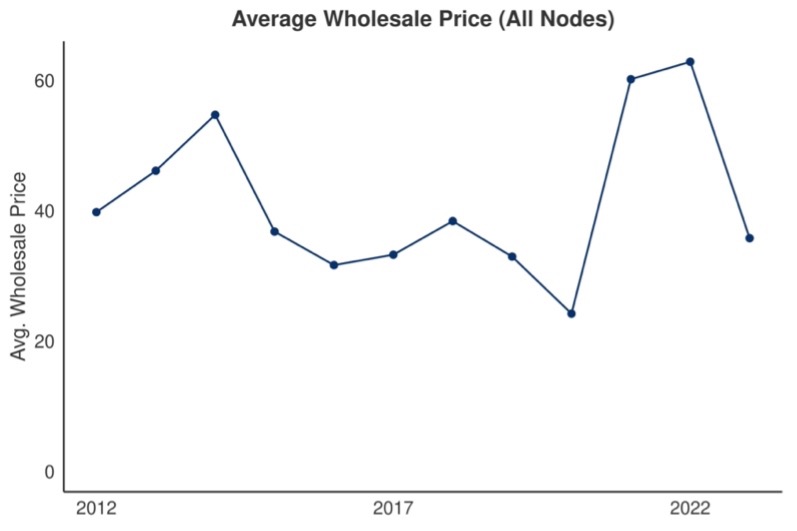
Figure 1. Average wholesale electricity price (2023$/MWh) declined in 2023 compared to 2021 and 2022. Average prices are calculated based on all nodes and hours within each of the 7 major ISOs/RTOs, and represent hourly average prices in the real time markets.
2023 wholesale electricity prices declined versus 2021 and 2022
Figure 1, available from ReWEP, shows the average price in 2023 was $36/MWh, down from $63/MWh in 2022. One driver of declining prices was the declining cost of natural gas. The Energy Information Administration (EIA) reported natural gas prices declined from $6.45 in 2022 to $2.54 in 2023 (based on the annual average per Million Btu spot price at the Henry Hub). Natural gas prices, of course, respond to global, domestic, and regional factors, and high prices in 2021 and 2022 were in part due to a combination of the invasion of Ukraine, sanctions on Russia, and impacts from the Covid pandemic. High natural gas prices helped drive up wholesale electricity prices in 2021 and 2022, but the prices receded in 2023.
Prices varied across regions
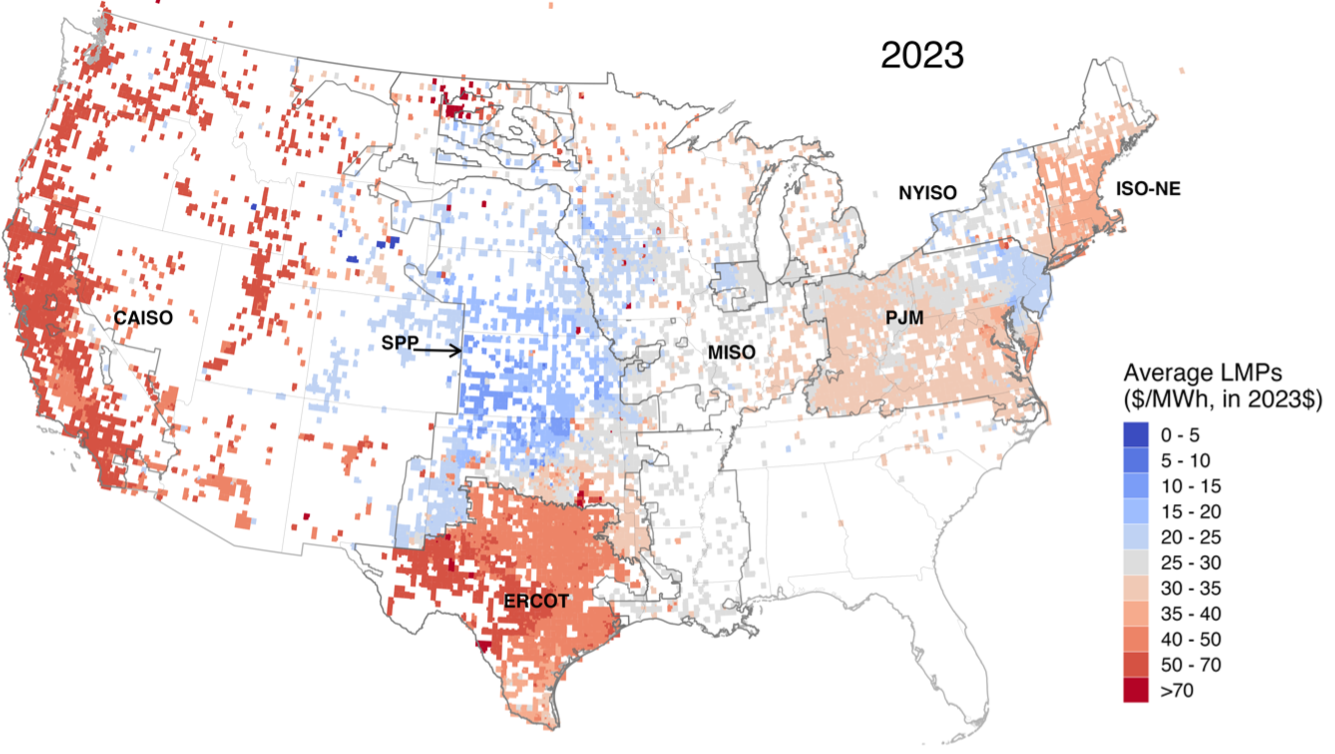
Figure 2 shows that average annual prices in ERCOT (Texas), CAISO (California), and the broader western region were high relative to other regions of the country. Prices in SPP (the region in the center of the country) were particularly low, with the lowest prices in SPP located near the highest levels of wind generation.

Figure 2. In 2023, average wholesale electricity prices (2023$/MWh) varied strongly by region. Shown are annual average real time electricity market prices based on data from all locational marginal price (LMP) nodes in 2023.
High wholesale electricity prices in ERCOT and CAISO were driven by different phenomena. In CAISO, high annual prices in 2023 were driven mostly by the high hourly prices in January 2023. In contrast to CAISO, high annual prices in ERCOT in 2023 were driven by high afternoon and early evening prices in June through September (Figure 3). These high prices were driven by record high electricity demand (at least partially associated with record summer heat in Texas in 2023). Both CAISO and ERCOT pricing patterns are discussed further in the full brief.

Figure 3. Prices in ERCOT (Texas) peaked in the summer early evening periods coinciding with record high electricity demand (e.g., air conditioning demand). The Texas market has very high price caps, allowing high prices due to scarcity to incentivize new supply and lower demand. Episodes of negative prices (light blue) are scattered in winter months as high amounts of wind power coincide with lower electricity demand. This screen-shot from the ReWEP tool shows the regional average hourly price by day and hour (365X24).
ReWEP can be used to investigate how renewable generation and electricity demand interacted to affect prices. These connections are discussed in the full brief.
We appreciate the funding support of the U.S. Department of Energy Solar Energy Technologies Office and Wind Energy Technologies Office in making this work possible.


