In this report, we will analyze the latest developments in the 3 largest US tight oil basins, which include the Permian, Williston, and the Eagle Ford. Together, these basins were producing over 7.5 million barrels of oil per day in May 2023, while outside these basins less than 1.2 million barrels of oil per day were produced in the Lower 48 states (only counting output from unconventional horizontal wells).
1- Total production by basin
The following overview shows the total tight oil production history for each of these basins through May 2023:
Total tight oil production in the 4 major basins, through May 2023.
Only the Permian basin has contributed to growth in US shale. The rest of tight oil production in the Lower 48, at about 3.5 million b/d, is more than 20% below the peak in October 2019.
2. Drilling Activity
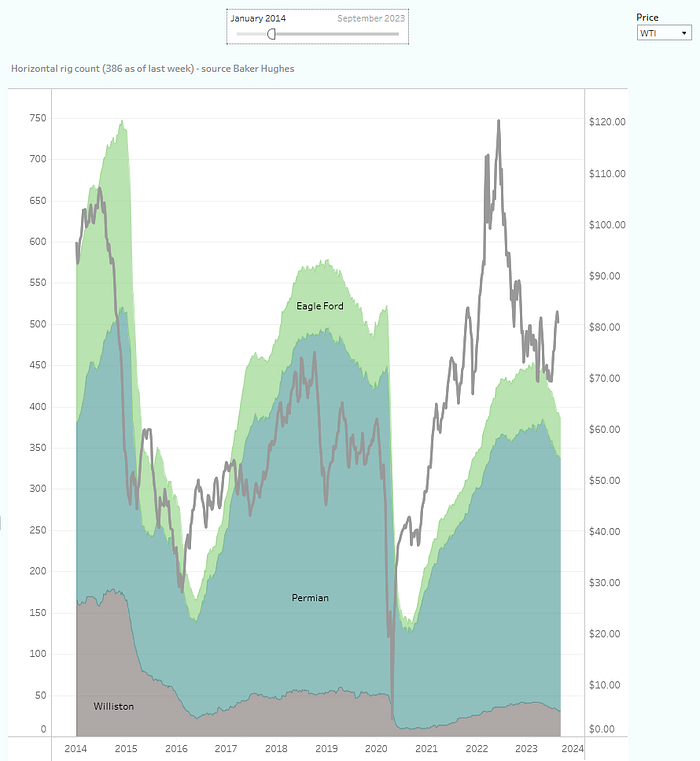
The horizontal, oil-directed, rig count in these 3 basins has fallen by 15% since the end of Q1 2023, to 386 rigs at the end of August (source: Baker Hughes). With WTI up by $10 in the recent 2 months, we expect to see an impact on drilling activity soon:
Horizontal rig count through August 2023, by basin, and WTI (right hand side).
Of these 386 rigs, 79% (305) are active in the Permian.
3. Supply Projection
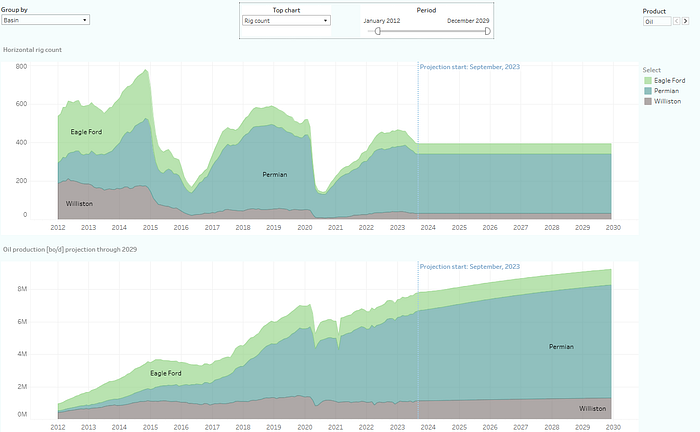
How would the oil supply from these basins look like if the rig count, rig efficiency and well productivity would remain the same? From our Supply Projection dashboard we can see the following outlook based on such a scenario:
Horizontal rig count (top) and historical and projected tight oil supply (bottom).
If we assume a constant rig count and no changes in rig efficiency and well productivity, we can see in the bottom chart that tight oil supply would continue to grow in the coming years, almost exclusively driven by the Permian. Thus, the recent decline in drilling activity was not enough to reverse the growth in tight oil production. However, the growth rate in the coming years has clearly fallen, and the assumption of unchanging well productivity may be too optimistic, as we’ll explore in the next section.
4. Well Productivity Trends
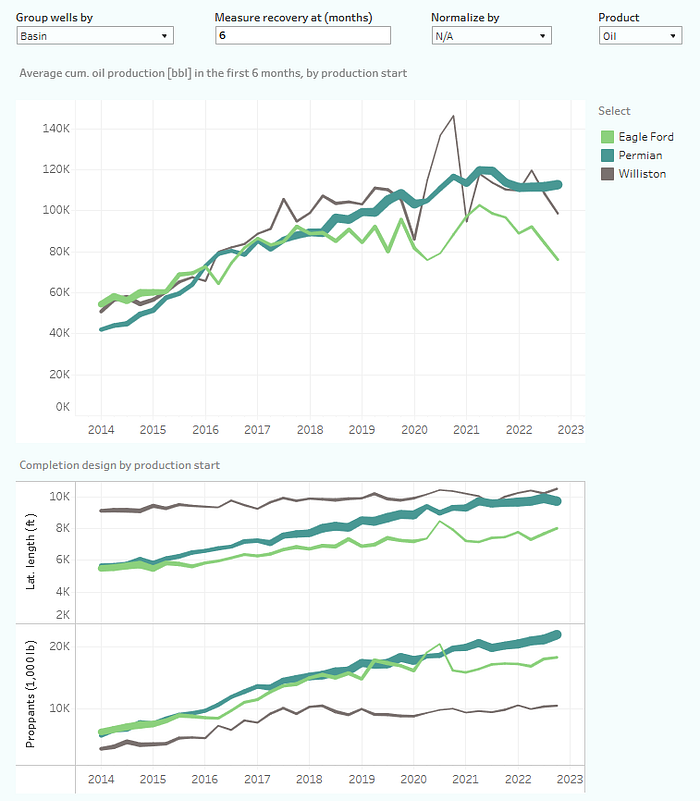
In this section, we’ll examine how well productivity has changed since 2014. The following graph plots the average cumulative oil production in the first 6 months, by first production date and basin:
Well productivity in the 3 key US tight oil basins. Horizontal oil wells only.
In the top chart, you can find that average well productivity appears to have peaked in all 3 basins, with the worst declines in the Eagle Ford and Williston. In the Permian, the almost 1,500 horizontal oil wells that started production in the last quarter of 2022 recovered on average 113 thousand barrels of oil during the first 6 months, versus 120 thousand barrels for the wells that came online 1.5 years earlier (Q2 2021). During that same period, average well results in the Eagle Ford fell by 25%.
In the bottom 2 charts, you can see the average lateral length and proppant loading plotted against the same first production date. It reveals that those completion parameters have still increased to some extent in recent years, which makes the declining well productivity trend even more worrisome.
The above metric is however based on a specific point in time (first 6 months). How have the full production profiles changed in the last decade?
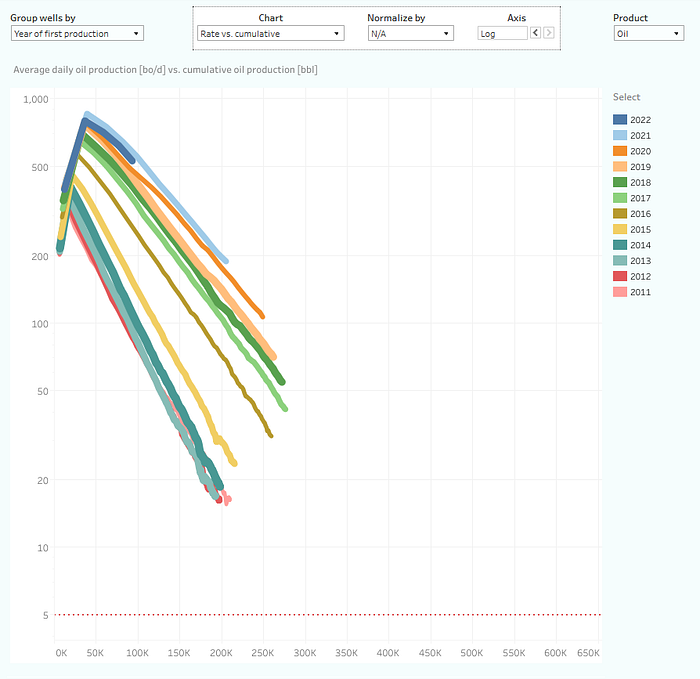
In the following chart, we have grouped all the horizontal oil wells in these 3 basins by their first production date, and plotted the average production rate against cumulative oil production. This allows us to view the full production pro- files to date:
Log rate versus cumulative production charts, by vintage. Horizontal oil wells only.
Here we can see a steady increase in performance since 2011. However, the wells that came online last year are performing slightly worse so far than the wells from the previous year. But completion activity has also shifted to the more productive Permian Basin, masking part of the underlying drop in productivity. Note that the curves representing recently completed wells are trending towards a EUR of around 400–500 thousand barrels of oil (x-axis).
5. Most Productive Counties
So far we have only shared high level trends. Now let’s take a closer look at well performance across counties and operators.
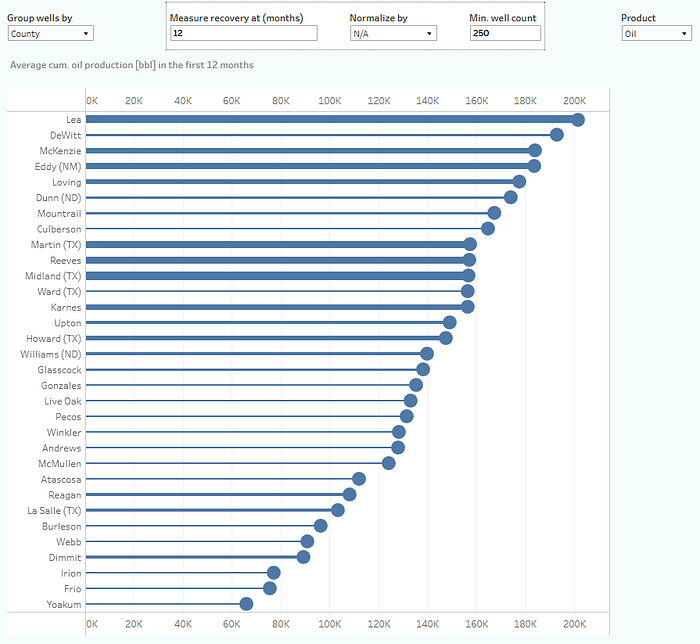
Here you can find a ranking of all major oil-producing counties within these 3 basins, ranked by the average cumulative oil production in the first year on production:
Main oil producing counties, ranked by average recent well results. Thickness indicates relative well count.
Only counties are included with at least 250 horizontal wells, and only wells are considered that started production in 2016 and that have predominantly produced oil.
Lea County in New Mexico has the top spot. The 3,370 horizontal oil wells that began production in 2016 have on average recovered 202 thousand barrels of oil during the first year of production. Yoakum is the last county in this list, with just 66 thousand barrels of oil (based on 371 horizontal wells).
6. Most Productive Operators
How about tight oil operators?
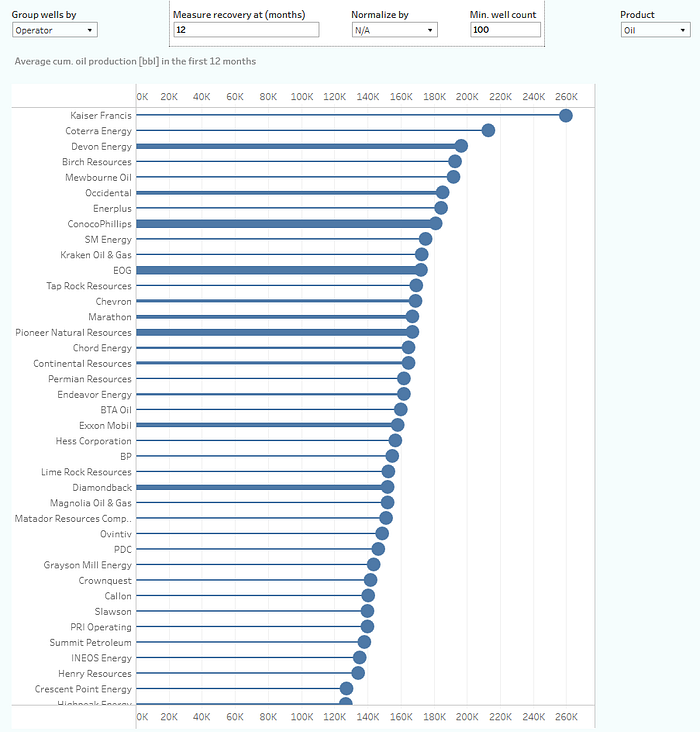
In the following chart, we rank all major tight oil operators in these 3 basins on the same metric, and again measuring only horizontal oil wells that have been completed since 2016.
Major US tight oil producers, ranked by average recent well results.
Kaiser Francis has a surprisingly large lead on the others; the 120 horizontal wells it completed (all of which are in the most prolific area of the Delaware Basin) recovered on average 260 thousand barrels of oil during their first year online.
7. Top Tight Oil Producers
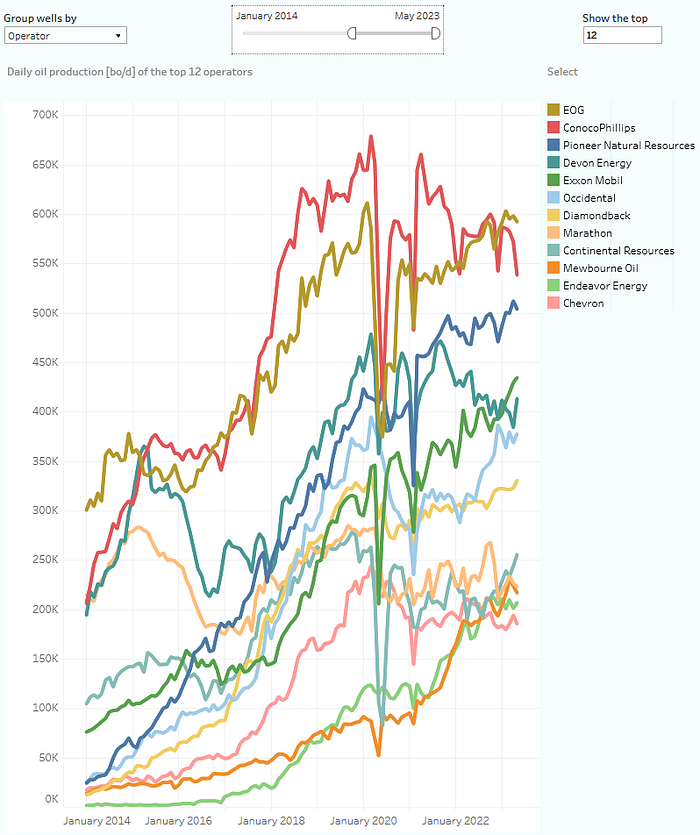
Finally, we’ll share a ranking of the 12 largest tight oil operators within these basins and their production history through May 2023:
Production history (b/d) of the top 12 tight oil operators in these 3 basins. Horizontal wells only.
EOG has taken back the lead from ConocoPhillips with about 600 thousand barrels of oil per day, of which over 2/3rds are now coming from the Delaware Basin.
Want to further explore industry data?
*All the graphs today come from Novi Insight Engine, which is an online analytics platform filled with interactive dashboards that allow you to explore the most recent shale oil & gas related data.
You can directly book a demo via novilabs.com/demo to see the energy analytics platform in action.


![[Report] THE 3 MAJOR US TIGHT OIL BASINS - Q3 2023](https://energynews.today/wp-content/uploads/2023/09/0BBO6lLtNrHkVfxQ7.png)
![[Report] THE 3 MAJOR US TIGHT OIL BASINS - Q3 2023](https://energynews.today/wp-content/uploads/2023/09/107028015-16468620192022-03-09t213112z_1256402390_rc27zs99uxg4_rtrmadp_0_ukraine-crisis-usa-gasoline-90x60.jpeg)
![[Report] THE 3 MAJOR US TIGHT OIL BASINS - Q3 2023](https://energynews.today/wp-content/uploads/2023/09/ammpwrv-90x60.jpg)


