sefa ozel/E+ via Getty Images
Even with lower rig counts, natural gas (NG1:COM) production remains stable perhaps slightly tilted toward growth. The idea for involuntary production cuts seems remote with summer wearing on. In the past few weeks, production, reported by the EIA shows values equal to or slightly above on a week over week basis. Although prices rose through June with the nation experiencing extreme hot weather, forecasters aren’t bullish that this trend will last for a normal length. Strong price support at this point relies on strong demand. In a strange convergence, stable may have changed meaning toward bearish, perhaps tyrannical. All isn’t bearish though with many analysts viewing bullish changes in the future. Is stable now really tyrannical? Let’s go find more definitions.
Latest Reports & Markets
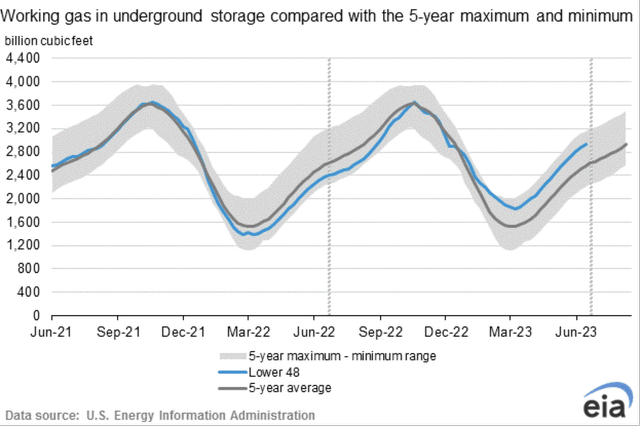
Beginning with the weekly storage report from the EIA shown next, the long-term deviation trend average continues (black line vs. the cyan line). For the most part the deviation created from the previous extremely warm winter continues constant, well mostly. A few more weeks of very hot weather might draw the two closer, a critical change in our view.

EIA NG Storage Report
A recent net gain measured at 40 billion cubic feet (BCF) was the lowest increase since early April of 2023. But, continuing, the next table summarizes production for several weeks.
| Prod BCF | May End | June | July | ||||
| 2023 | 105.4 | 106.2 | 106.3 | 104.9 | 105.8 | 108.0 | 107.3 |
| 2022 | 102.1 | 101.6 | 103.1 | 103.8 | 104.1 | 104.1 | 104.4 |
Production comparisons year over year show that the two are converging slowly with the exception of the last two weeks with its sudden bust upward.
Rig count for different regions continues a bearish direction. Last week, gas rigs fell by 3, now at 133. Previously, the count averaged approximately 160.
Price Action
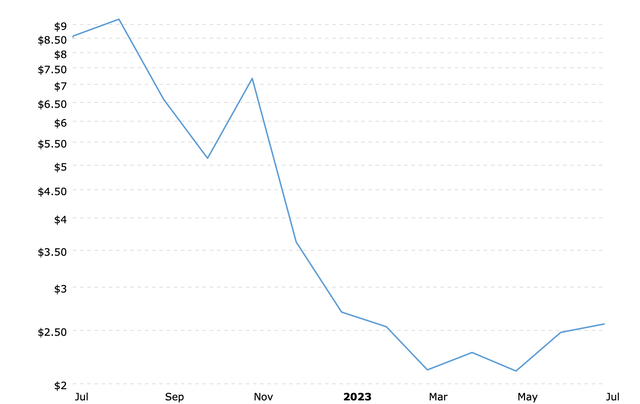
With demand slightly higher and the rig count dropping, prices, shown below, have rebounded modestly.

MacroTrends
Natural gas futures seesawed within a narrow range of gains and losses Friday, as traders weighed strong near-term cooling demand against light LNG volumes and abundant supplies. The August Nymex gas futures contract ultimately settled at $2.539/MMBtu, down six-tenths of a cent day/day. September shed four-tenths of a cent to $2.530.”
Competing factors tore into market pricing, high cooling demand vs. low LNG demand acted to confuse traders leaving the direction undetermined.
Markets Looking Ahead
The story isn’t finished. Looking ahead, LNG exports remain shunted with the Sabine facility at half rates from maintenance. At the end of June, rates averaged 10+ BCF lower from highs in March at 14 BCF.
New contracts locking in place future LNG sources are in abundant demand. China leads the pack signing with countries outside of the U.S. nevertheless sealing in sources that could go otherwise elsewhere.
In Europe, with extra ordinary warm summer weather in northwest Europe, the location for most of the natural gas usage, prices have trended higher at least temporarily. But again, industry has been slow to restart its heavy use and economies now in recession shunted demand. European gas storage sits at 76% full with an expectation for 90% full in November.
Christopher Lewis wrote in his article, Natural Gas Price Forecast – Natural Gas Pulls Back Slightly:
All things being equal, this is a market that I think is going to continue to see buyers jump into the market as we have to worry about the European supply, as the market continues to see and lack of supply being a real issue with Russian gas offline. Because of this, the Europeans will be buying liquefied natural gas from the Americans, which of course gets much more expensive.”
Technical Analysis & Cycle Time
With most commodities, a technical, a chart factor, induces important influences. The Henry Hub price sets above the 50 day and below the 200 day moving averages, a technical position destine for volatility. This comes during a season of natural cyclical weakness. Both of these factors suggest price weakness short-term. Translated: buyers beware it could be volatile.
Risk vs. Risk
Natural gas, in our view, sits fragilely tittering on each side vying for dominance. One author opined:
All things being equal, I think we’ve got a situation where the market is going to be one that you will have to be very patient with, but eventually we should see a breakout.”
We agree, it is about patience. Usage is headed up from electrical power generation in the U.S. and LNG exporting to Europe. The market expects three new plants coming on-line beginning in 2024 through 2027. This demand comes on the heels of Russian gas boycotts.
In essence, risk resides on both sides. Users risk geometric price increases from demand or production changes. Investors face continued major downside risks from abnormal weather or slight production increases. The jury is still out. Investors might still find themselves walked on by the markets. Either is possible. In our view, patience is the most important virtue. With prices already below most production breakeven, production destruction seems the most likely direction. Any investing ought to be in best of the best, for example, Antero Resources (AR). It is the lowest cost producer with minimal debt. It is a waiting game, one likely to turn bullish, once again reversing the tyranny.
Editor’s Note: This article covers one or more microcap stocks. Please be aware of the risks associated with these stocks.


