FreezeFrames
Part I – Introduction
Houston-based EOG Resources, Inc. (NYSE:EOG) released its first quarter 2023 results on May 4, 2023.
Important note: This article updates my preceding article, published on May 27, 2023. I have followed EOG on Seeking Alpha since 2016.
EOG Resources produces from five Premium Basins and is a pure-play U.S. producer with a small production from Trinidad.
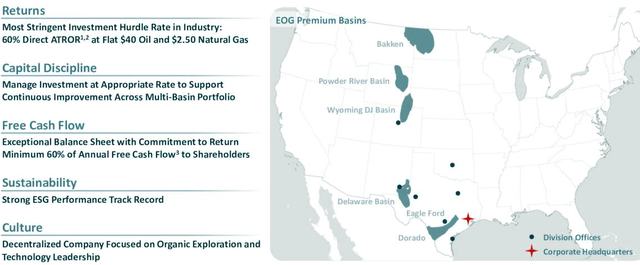
EOG Map Assets Presentation (EOG Presentation)
CEO Ezra Yacob said in the conference call:
Strong first quarter execution from every operating team across our multi-basin portfolio has positioned the company to deliver exceptional results in 2023. Production, CapEx, cash operating costs and DD&A all beat targets, which underpinned our excellent financial performance during the first quarter.
1 – 1Q23 Results Snapshot And Commentary
EOG Resources reported a first-quarter 2023 adjusted earnings per share of $2.69, beating analysts’ expectations. The results were lower than the year-ago quarter’s adjusted earnings of $4.00 per share.
Total quarterly revenues increased to $6,044 million from $3,983 million in 1Q22, beating analysts’ expectations.
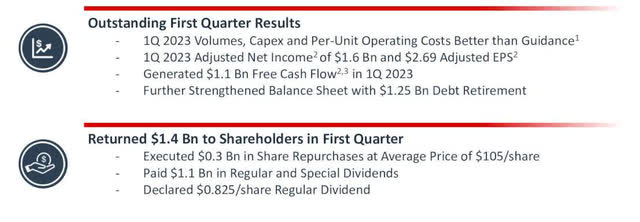
EOG 1Q23 Highlights (EOG Presentation)
EOG Resources’ total volumes increased 6.8% YoY to 84.9M Boep/d on higher U.S. production or 943K Boep/d. The company expected production between 902.6K and 939.4K Boep/d for the First quarter 2023.
The quarter’s crude oil and condensate production totaled 457.7K Boep/d, up 1.7% from the year-ago level. Natural gas liquids volumes increased by 11.5% yearly to 212.2K Bbls/d. Natural gas volume rose to 273.1K Boep/d from the year-earlier quarter’s 243K Boep/d.
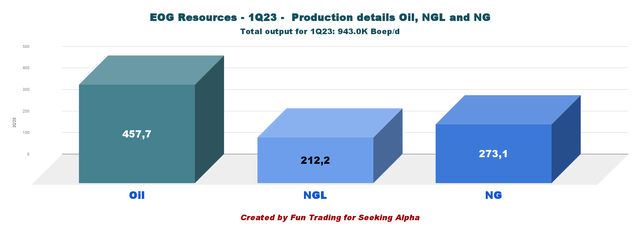
EOG 1Q23 Production detail Oil, NGL, NG (Fun Trading)
CEO Ezra Yacob said on the conference call:
Our shift to premium drilling several years ago has helped to decouple EOG’s performance from short-term swings in the market. The result is an ability to deliver consistent, operational and financial performance that our shareholders have come to expect and that drives long-term value through the cycle.
2 – Stock Performance
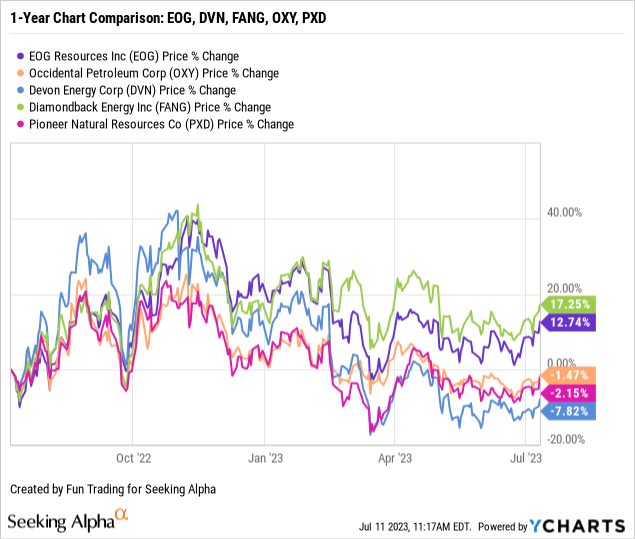
All five companies in the chart below have dropped significantly since November 2022. However, EOG is up 13% on a one-year basis.
EOG Resources produces oil and gas from its U.S. shale assets, representing 97.0% of the total output 1Q23. The production from the U.S. comes from five basins: Bakken, Powder River, Wyoming DJ, Delaware, and Eagle Ford (including the dry gas play Dorado).
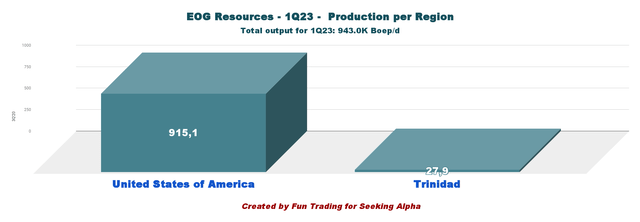
EOG Production per segment 1Q23 (Fun Trading)
Production in the USA was up 8.7% from the same quarter a year ago.
| Production per Region in K Boep/d | 1Q22 | 2Q22 | 3Q22 | 4Q22 | 1Q23 |
| United States of America | 841.5 | 886.1 | 891.6 | 883.8 | 915.1 |
| Trinidad | 41.8 | 34.6 | 27.6 | 25.3 | 27.9 |
| TOTAL | 883.3 | 920.7 | 919.2 | 909.1 | 943.0 |
Part II – EOG Resources – 1Q23: Balance Sheet History. The Raw Numbers
| EOG Resources | 1Q22 | 2Q22 | 3Q22 | 4Q22 | 1Q23 |
| Total Revenues in $ million | 6,755 | 8,645 | 7,598 | 6,494 | 5,579 |
| Oil Revenues in $ Million | 3,983 | 7,407 | 7,593 | 6,719 | 6,044 |
| Net income in $ Million | 390 | 2,238 | 2,854 | 2,277 | 2,023 |
| EBITDA $ Million | 1,392 | 3,841 | 4,610 | 3,779 | 3,435 |
| EPS diluted in $/share | 0,67 | 3.81 | 4.86 | 3.87 | 3.45 |
| cash from operating activities in $ Million | 828 | 2,048 | 4,773 | 3,444 | 3,255 |
| Capital Expenditure in $ Million | 1,009 | 1,424 | 1,205 | 1,362 | 1,624 |
| Free Cash Flow in $ Million | -181 | 624 | 3,568 | 2,082 | 1,631 |
| Total cash $ Billion | 4.01 | 3.07 | 5.27 | 5.97 | 5.02 |
| Long-term debt in $ Billion | 5.10 | 5.09 | 5.08 | 4.86 | 3.82 |
| Dividend per share in $ (+ special dividend) | 0.75+1.80 | 0.75+1.70 | 0.825+1.50 | 0.825+1,00 | 0.825 |
| Shares outstanding (diluted) in Million | 586 | 588 | 587 | 587 | 587 |
Source: EOG Resources.
Part III – Analysis: Revenues, Earnings Details, Net Debt, Free Cash Flow, And Oil Equivalent Production
1 – Total Revenues And Others Were $6,044 Million in 1Q23
Note: Oil revenues were $5,579 million in 1Q23.
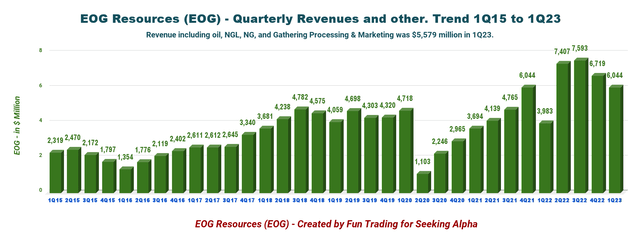
EOG Quarterly Revenues History (Fun Trading)
The company’s net income was $2,023 million, or earnings per share of $3.45, compared to $390 million or $0.67 per share a year ago.
Total operating expenses for 1Q23 were $3,472 million, higher than the $3,437 million a year ago.
Transportation costs increased to $236 million from $228 million a year ago. Also, Lease and well expenses increased to $359 million from $318 million a year ago. Finally, the company reported gathering and processing costs of $159 million, higher than the year-ago quarter’s $144 million.
Earnings were Better-than-expected due to higher oil equivalent production reaching 943K Boep/d.
2 – Free Cash Flow Was $1,631 Million In 1Q23
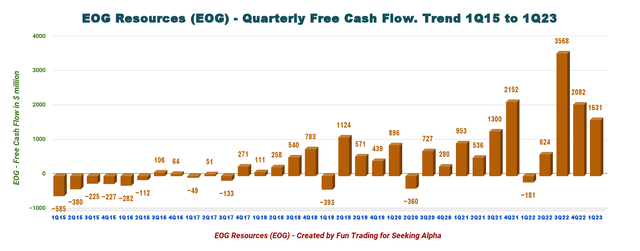
EOG Quarterly Free Cash Flow History (Fun Trading)
Note: The organic free cash flow is the cash from operating activities minus CapEx. EOG uses another way to calculate the generic Free cash flow, which is not comparable to other E&P companies and indicated $1,070 million.
The free cash flow for the first quarter of 2023 was $1,631 million, and the trailing 12-month free cash flow was $7,905 million.
EOG Resources declared a regular quarterly dividend of $0.825 per share and repurchased $310 million of shares during the first quarter.
3 – Oil-Equivalent Production And Other
3.1 – Oil Equivalent Production
EOG Resources’ oil production increased sequentially in the first quarter. Total production was a record of 943.0K Boep/d, up 6.8% from last year and up 3.7% sequentially. The chart below shows that the entire production reached a record this quarter.
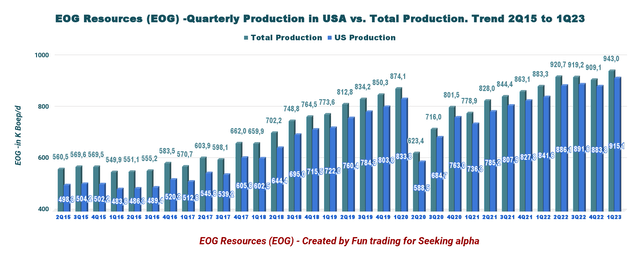
EOG Production US and total History (Fun Trading)
CFO Tim Driggers said in the conference call:
Compared with the prior year, first quarter production volumes increased 2% for oil and 7% overall. We mitigated most of the inflationary headwinds to limit the increase to per unit cash operating costs to just 3% or $10.59 per BOE,
3.2 – Oil Production Detail: Oil, NGL, And NG
EOG relies significantly on crude oil, representing 48.5% of the total output in 1Q23.
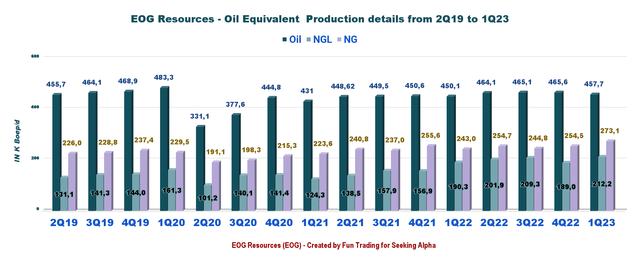
EOG Quarterly Oil Equivalent Production History (Fun Trading)
The company’s oil price (composite) realized this quarter was $77.26 a barrel, down from $96.00 a year ago.
In addition, natural gas was $3.47 per Mcf, a decline of 35.7% YoY. Finally, NGL prices were $25.67 per barrel declining significantly from $39.77.
Below is the chart history of the Oil and NG price composite.
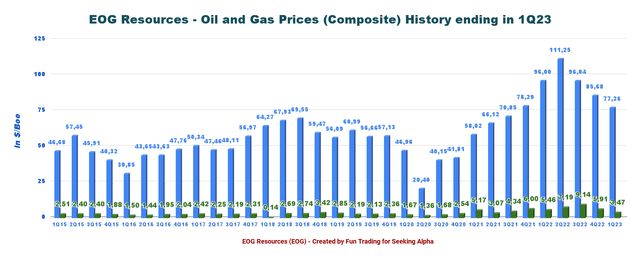
EOG Quarterly Oil and NG Prices History (Fun Trading)
4 – No Net Debt and good Cash position. Excellent Profile with net cash of $1,198 million in 1Q23.
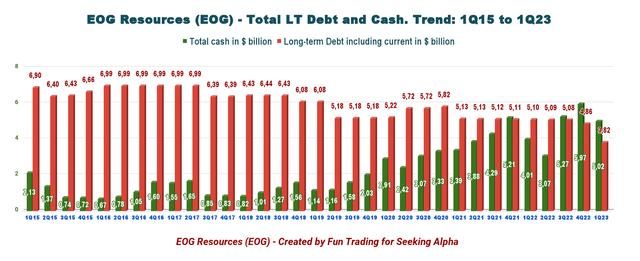
EOG Quarterly Cash versus Debt History (Fun Trading)
As of March 31, 2023, EOG Resources had cash and cash equivalents of $5,018 million. Long-term debt was reported at $3,820 million, down from $4,863 million in 4Q22.
The current portion of the long-term debt was recorded at $33 million after retiring $1.25 billion in debt this quarter. The next maturity is a $500 million bond due April 2025.
EOG is net debt free, a huge plus, especially in this bearish trend for oil and gas prices.
CEO Ezra Yacob said on the conference call:
We strengthened our balance sheet by retiring debt, paid out nearly 100% of free cash flow in regular and special dividends, and we utilized our repurchase authorization to buy back $310 million worth of stock late in the quarter during a significant market dislocation.
5 – 2Q23 and 2023 Guidance
For 2023, EOG Resources forecasts total production between 944.0K-1,027.6K Boep/d, representing an increase of 8.5% (mid-point) from what was reported in 2022 or 908.2K Boep/d.
The company’s CapEx is expected to be $5,800-$6,200 million for the year, with $1,550-$1,750 million likely used in the second quarter.
For 2Q23, the company expects production of 939.5K-974.7K Boep/d, up 1.5% sequentially.
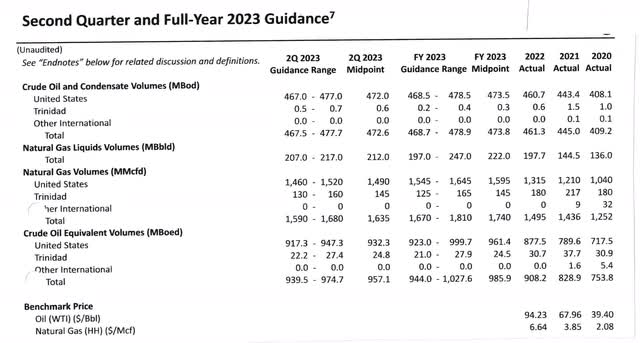
EOG 2023 Guidance (EOG Press release)
Part IV – Technical Analysis And Commentary
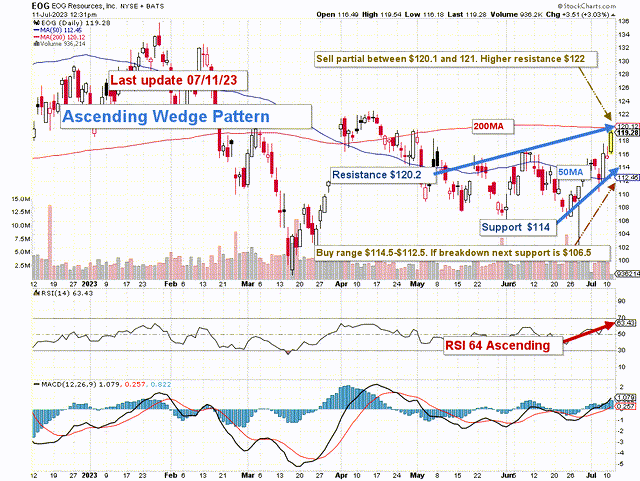
EOG TA Chart Short-Term (Fun Trading StockCharts)
Note: The chart has been adjusted for dividends.
EOG forms an ascending wedge pattern with resistance at $120.2 and support at $114.0. RSI is 64 approaching overbought territory.
A rising wedge is a bearish stock pattern that begins wide at the bottom and contracts as trading range narrows and the prices move higher.
The short-term trading strategy is to trade LIFO for about 40%-50% of your position. I have increased the short-term portion because of the increasing volatility of the oil and gas sector and the risk of a global recession in late 2023.
I suggest selling between $120.1 and $121 with higher resistance at $122 and waiting for a retracement between $114 and $112.5 with possible lower support at $106.5.
Watch oil and gas prices like a hawk.
Warning: The TA chart must be updated frequently to be relevant. It is what I am doing in my stock tracker. The chart above has a possible validity of about a week. Remember, the TA chart is a tool only to help you adopt the right strategy. It is not a way to foresee the future. No one and nothing can.


