Justin Sullivan
A rising market with narrow breadth
This year’s stock market results have occurred among a small group of names, the so-called AI Boom stocks, with most of the rest of the broader market not participating.
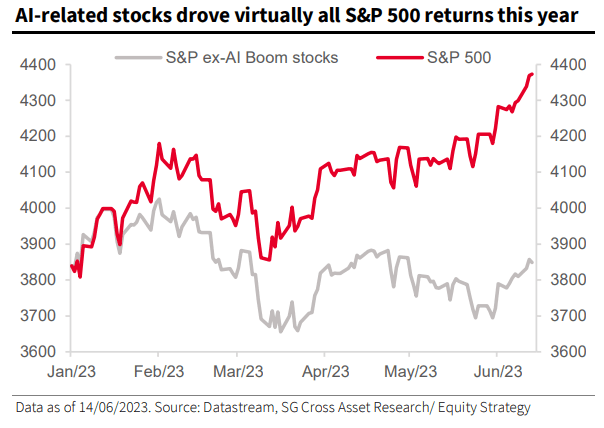
Figure 1: Narrow market breadth (SG)
However, when we look at the performance of the different equity industries it becomes clear that not only technology stocks are performing great. The best performing industry isn’t e.g. Semiconductors, but… Homebuilders.
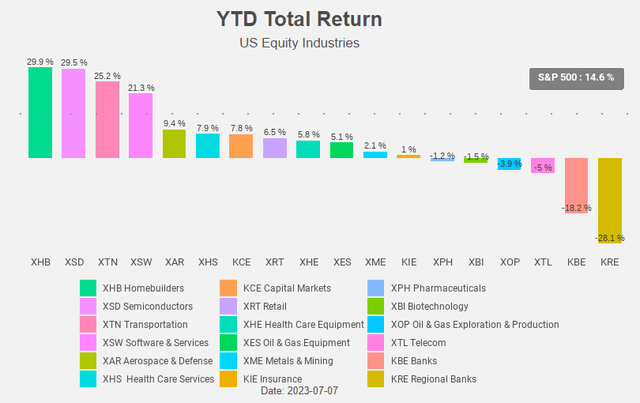
Figure 2: Total return chart (Author)
Homebuilders remain, together with Transportation, Software & Services, Semiconductors and Aerospace & Defense, one of the equity industries with the strongest long term uptrend.
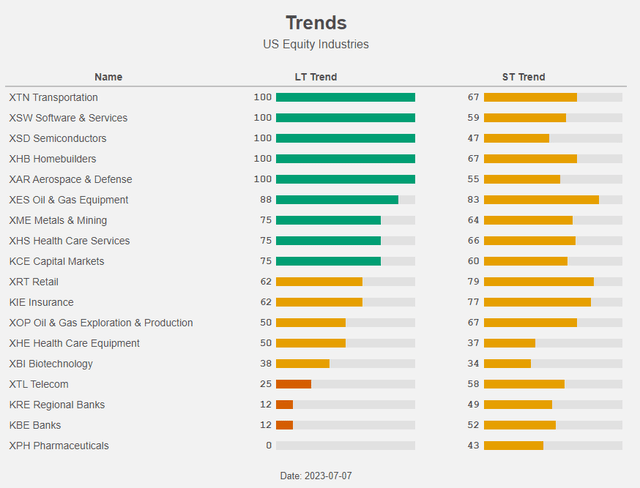
Figure 3: Trends (Author)
There are quite some headwinds for homebuilders. Rising interest rates lead to much higher mortgage rates which in turn is devastating for housing affordability.
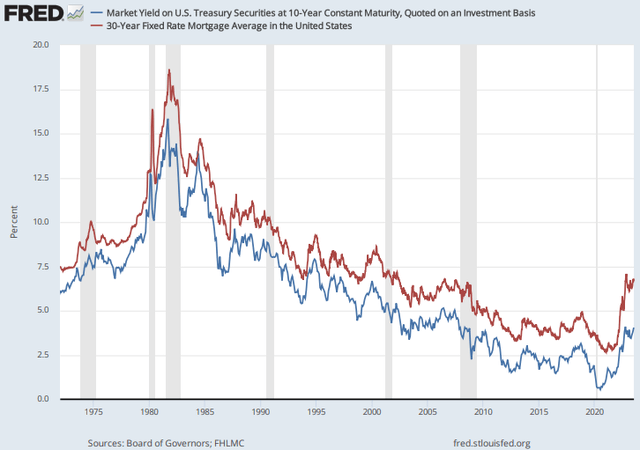
Figure 4: Rising rates (FRED)
Average monthly mortgage payments were below $1500 in 2020 and have risen now to above $2500.
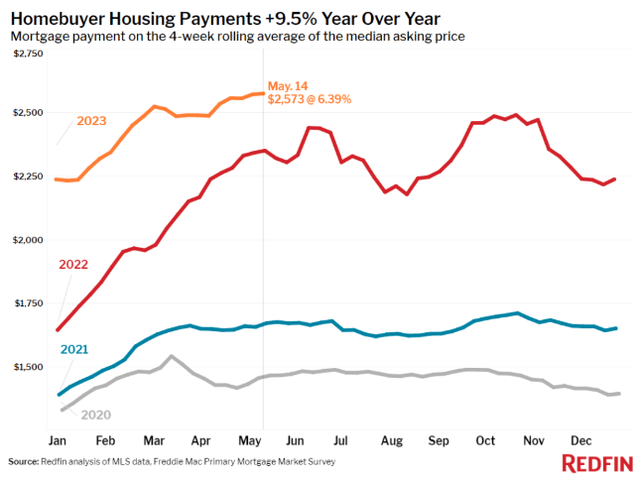
Figure 5: Mortgage payment (Redfin)
Federal Reserve Chair Jerome Powell even said the U.S. housing market needed to undergo a “correction” period so that purchasing a house is not an impossible prospect for potential buyers.
The higher mortgage rates do not only lead to a low housing affordability, but it also translates in a big reduction in the supply of homes for sale. Many homeowners have loans with a rate well below current mortgage rates and want to keep this low mortgage rate. This keeps of course the supply of existing homes at a very low level.
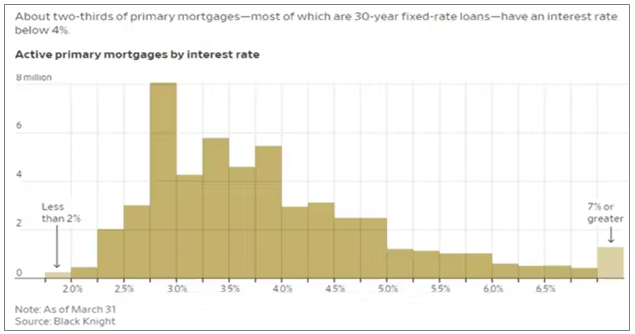
Figure 6: Mortgages by interest rate (Black Knight)
This lack of existing home inventory boosts the homebuilder confidence. The limited existing inventory has put a renewed emphasis on new construction. The result: again a solid gain for homebuilder confidence in May.
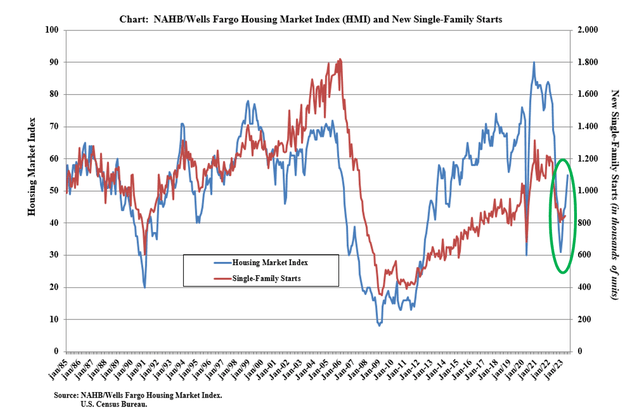
Figure 7: Homebuilder confidence (NAHB)
Despite Powell’s call for a correction in home prices, home prices in the US rose for a third straight month as the tight supply of existing homes is met with growing buyer demand. Demand remains strong, boosted by the strong labour markets and healthy household balance sheets. New home sales meanwhile advanced in May to the fastest pace in over a year. This is of course great news for homebuilders.
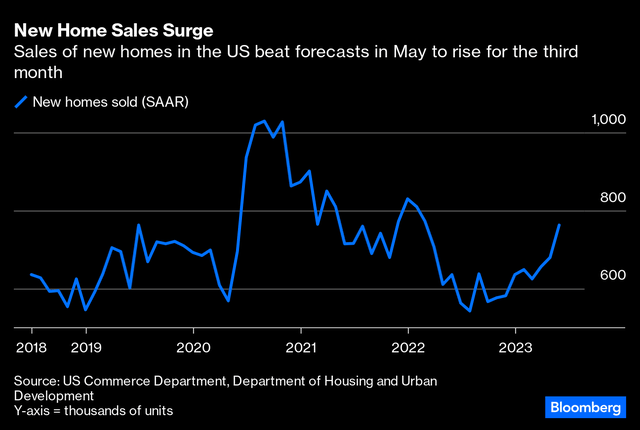
Figure 8: New home sales (Bloomberg)
Homebuilder ETFs
The three main homebuilder ETFs are the iShares U.S. Home Construction ETF (ITB), the Invesco Dynamic Building & Construction ETF (NYSEARCA:PKB) and the SPDR Homebuilders ETF (XHB). All three are in a strong long term uptrend.

Figure 9: Trends (Author)
Despite the nice recent performance, Homebuilders still aren’t expensive. On a price to book and a price to earnings level they trade at a wider discount than usual compared to the S&P 500.
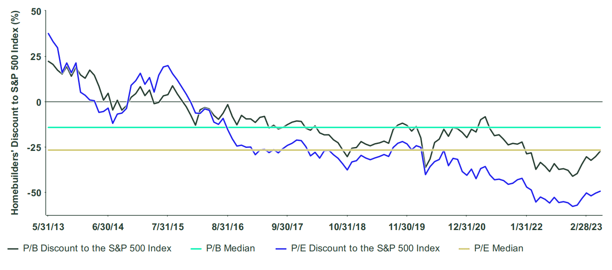
Figure 10: Homebuilder valuation (SPDR)
When we look at the past performance of PKB, XHB and ITB (in the period between Jan 2007 and Jun 2023) the performance is more or less in line with each other but the ETF with the best performance is clearly PKB. PKB has an expense ratio of 0.57%, which is bigger than the expense ratio of the two other ETFs.
At the same time PKB is however more defensive with a lower volatility, a lower beta and a lower maximum drawdown.

Figure 11: Risk and return metrics (Portfolio Visualizer)
It will hence not come as a big surprise that PKB has the best risk-adjusted return.
Invesco Dynamic Building & Construction ETF
PKB offers exposure to the U.S. homebuilding industry, and is based on the Dynamic Building Construction Intellidex Index. The Index is comprised of securities of 30 US building and construction companies. These are companies that are primarily engaged in providing construction and related engineering services for building and remodeling residential properties, commercial or industrial buildings, or working on large-scale infrastructure projects, such as highways, tunnels, bridges, dams, power lines, and airports. The Index and PKB are rebalanced and reconstituted quarterly in February, May, August and November.
The Intellidex Methodology is designed to objectively identify those stocks within a particular market segment that have the greatest potential for capital appreciation. The indexes seek to go beyond traditional measurements to consider the fundamentals that drive healthy companies and growth. The methodology evaluates companies quarterly, based on a variety of factors grouped into 5 broad categories:
- Price Momentum,
- Earnings Momentum,
- Quality,
- Management Action &
- Value.
For price momentum the main factors are price relative to 52-week high, volatility normalized price momentum and stock turnover. Earnings momentum looks at analyst estimate changes, cash flow surprise, and estimate revisions. Quality is defined by ROE, asset turnover and free cash flow margin. For management action the index provider takes change in capital expenditure, share buybacks and total dividends paid into account. At last, the measures for value are book value, the ratio of sales to enterprise value and the ratio of cash to equity.
Within each category, factors are combined to form a composite exposure. The model is then customized to each sector to allow for more consistent alpha generation across sectors.
PKB certainly created alpha over the last 12 months.
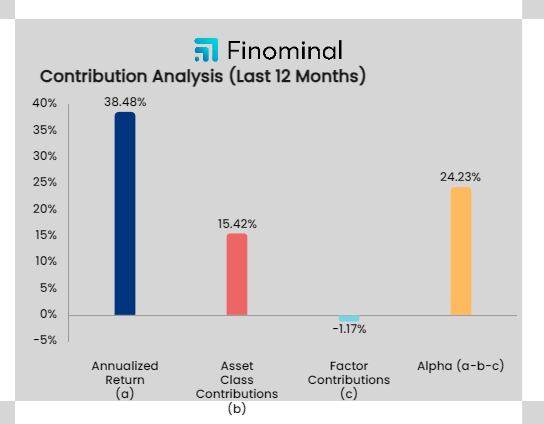
Figure 12: Contribution analysis (Finominal)
The biggest sector allocation goes to the Consumer Discretionary sector, which contains the building related industries Homebuilding and Home furnishings.
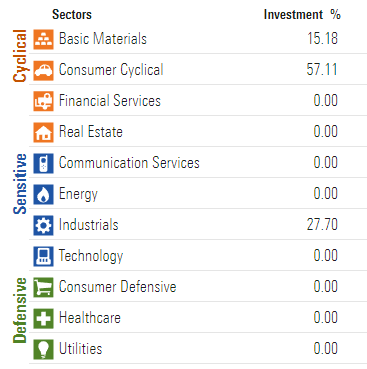
Figure 13: Sector allocation (Morningstar)
The second biggest sector is Industrials which contains the building related industries Building products and Construction & Engineering. The third sector in which PKB invests is Materials, with the building related industry Construction Materials.
Figure 14 shows the 10 biggest positions.
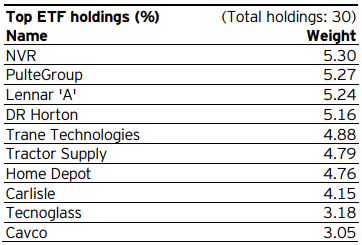
Figure 14: PKB Top 10 holdings (Invesco)
Like we said before, homebuilders aren’t expensive: PKB is trading at a PE of 11 (and has a dividend yield of (only) 0.59%).
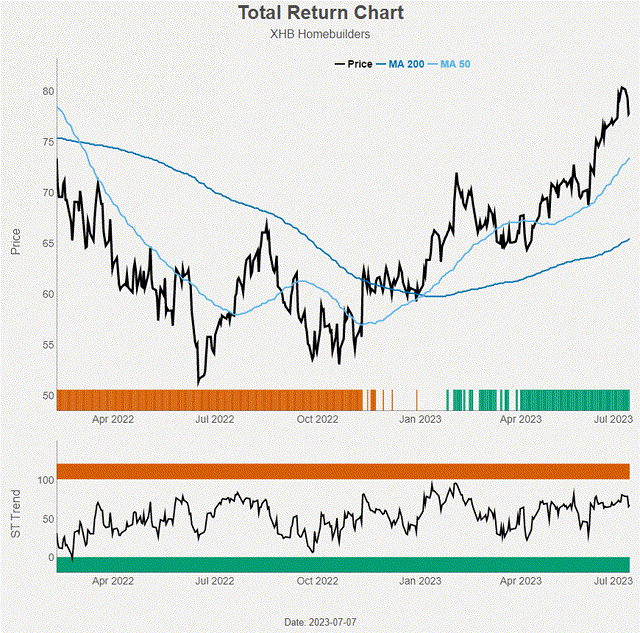
Figure 15: Total return chart (Author)
Conclusion
The rising (mortgage) rates are devastating for housing affordability which is of course a strong headwind for homebuilders. However, many homeowner are “locked in” by their low mortgage rates from before the rate rise. They are reluctant to sell their home which strongly limits supply. Newly built homes have to fill the void and this is a very strong tailwind for homebuilders.
The best performing (and at the same time most defensive) homebuilder ETF is the Invesco Dynamic Building & Construction ETF. Despite the nice performance year to date homebuilders still have an interesting valuation. Use the recent price weakness to buy PKB. Like the other Homebuilder ETFs it remains in a strong long term uptrend.


