knowlesgallery/iStock via Getty Images
Over the past two months I’ve written three pieces covering US oil and natural gas exploration & production (E&P) companies including a hold rating on Devon Energy (DVN), a bullish piece on gas-focused producer Southwestern Energy (SWN) published in early May, and a bearish article on Comstock Resources (CRK) back in late April.
My approach to valuing these companies is straightforward and consists of three main steps.
First, I create a simple model of the producer’s cash flow breakeven costs based on management’s guidance for capital spending, hedges, costs, and production potential.
Second, I examine the current calendar strip pricing for crude oil, natural gas liquids (NGLs) and natural gas and calculate the value of the producer’s production based on the mix of hydrocarbons produced.
Finally, I use this model to estimate the company’s free cash flow potential over the next few years and derive a discounted cash flow (DCF) target price for the stock.
The energy business is cyclical as are, of course, commodity prices. Therefore, to recommend buying an E&P, I’m looking for stocks trading at a significant discount to my estimated fair value; thus, even if commodity prices disappoint, there’s room for the stock to rally.
In this issue, I’ll use a similar methodology for Range Resources (NYSE:RRC), a company with over 500,000 net acres located in the Marcellus Shale field in Pennsylvania.
The Marcellus is a widely distributed shale play located in Appalachia and it’s primarily considered a natural gas field. However, the majority of RRC’s acreage produces so-called wet gas, which is a mixture of methane (natural gas) as well as natural gas liquids (NGLs) including propane, ethane, butane and natural gasoline.
Indeed, as I’ll explain in just a moment, NGLs account for around 29% of RRC’s total energy-equivalent output and are crucial to underpinning my fair value estimate, and bullish outlook, for the stock.
So, let’s start with this:
Range Resources Breakeven Costs
When modeling a company like Range, I start by examining the company’s recent results. In this case, here’s a look at RRC’s costs, production volumes and realized prices in the first quarter of this year (Q1 2023):
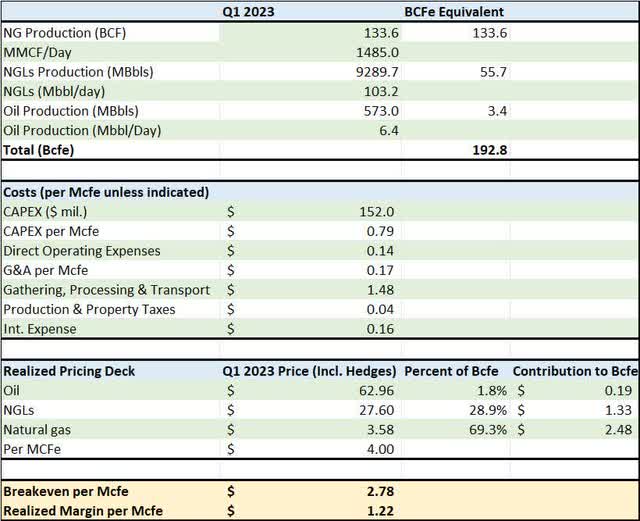
Q1 2023 Cash Flow Model for RRC (Range Resources Q1 2023 Earnings Release)
The data reported in this table is derived from RRC’s Q1 2023 earnings press release and the 10-Q filed with the SEC.
The table is divided into 4 main parts:
Starting from the top, the first section offers a look at the company’s total production volumes and production mix in Q1 2023. The next part of the table outlines RRC’s cash production costs, while the third section looks at the prices RRC was able to obtain from selling oil, gas and natural gas liquids (NGLs) in Q1.
Finally, the fourth segment of my table shows a rough estimate of RRC’s cash breakeven cost — if the value of every thousand cubic feet equivalent (Mcfe) sold by RRC is above $2.78, the company should be expected to generate free cash flow and vice versa. The realized margin per Mcfe is simply the price at which RRC was able to sell production in Q1 2023 less the company’s cost – the higher the margin, the more free cash flow RRC can generate.
In the first quarter, RRC produced a total of 192.8 billion cubic feet equivalent of natural gas production. Of that total, 69.3% consisted of natural gas production (133.6 Bcf) and 28.9% was natural gas liquids (55.7 Bcfe).
There are roughly 6 million British Thermal Units (BTUs) of energy in a barrel of oil and 1 million BTUs in a thousand cubic feet (mcf) of natural gas so, by convention, liquid hydrocarbons (oil and NGLs) are converted into cubic feet equivalent using a ratio of 1 barrel to 6 mcfe.
Note that the letter “M” is the Roman numeral for 1,000; by convention M means 1,000 and MM means 1,000 multiplied by 1,000, which is 1 million.
So, two points really jump out from my table.
First, while many investors seem to view RRC as a natural gas producer, 28.9% of the company’s total production in Q1 2023 was natural gas liquids including ethane, butane and propane.
Second, and even more important, look at the realized pricing deck on my table. The prices listed for oil, NGLs and natural gas are RRC’s all-in prices generated for production in Q1 including the impact of the company’s hedging activity. Just because the energy content of a barrel of NGLs is similar to 6 mcf of gas doesn’t mean the value of a barrel of NGLs is the same as 6 mcf of gas.
In fact, in Q1, RRC sold each mcf of natural gas at a price of $3.58 and NGLs for $27.60/bbl, so 1 barrel of NGLs was worth about the same as 7.7 mcf of natural gas. That’s a significant uplift to the value of RRC’s production relative to an E&P that focuses primarily on a dry natural gas play like the Haynesville Shale in Louisiana, where there is very little NGLs or crude oil in the raw natural gas stream.
In Q1 2023, almost one-third of the company’s $4.00/Mcfe in realized value ($1.33 of the $4/Mcfe) for its production is due to the value of NGLs.
The middle section of my table covering cash production costs for Q1 2023 is fairly self-explanatory, so let’s move through it quickly. The lion’s share of capital spending (CAPEX) represents money spent to drill and complete (fracture and put into production) new wells in RRC’s acreage. In Q1, the company spent $152 million, which works out to $0.79/Mcfe.
Direct operating expenses would include most of the costs associated with maintaining RRC’s existing wells and equipment related to their production.
The Marcellus Shale of Appalachia is the largest gas field in the US and it’s the cheapest-to-produce major gas shale field. Wells in the region are prolific, so producers there tend to have relatively low operating and cash costs on a $/Mcfe basis compared to E&Ps in other regions.
For example, back in late April, I calculated the CAPEX for Haynesville-focused Comstock Resources (CRK) at more than $2/Mcfe. Meanwhile, CRK’s Lease Operating Expenses (LOE) – similar to what RRC calls direct operating expenses – are around $0.22/Mcfe compared to $0.14 for RRC in my table above.
Instead, the biggest single cost center for RRC is gathering, processing and transport. Gathering is the process of collecting gas from individual wells via small diameter pipelines. Processing involves separating NGLs from the raw natural gas stream, and transport refers to the cost of pipeline transportation.
RRC has hefty processing costs simply because it produces significant volumes of gas from “wet gas” acreage within the Marcellus. The raw natural gas stream from these wells has a high volume of NGLs that need to be removed from the gas stream via processing. Further, since RRC produces a mixture of NGLs, they also perform what’s known as fractionation to separate the NGLs into barrels of propane, butane, iso-butane and ethane for sale as separate products.
RRC’s hefty transport costs are a function of the geographic location of the Marcellus Shale field. This region of the US produces a lot more gas than can be consumed locally, so volumes must be transported significant distances to major demand centers such as the US Gulf Coast or the Midwest.
Marcellus producers try to sell as little gas as possible into the local market, because the Marcellus region is chronically oversupplied, and prices are low:
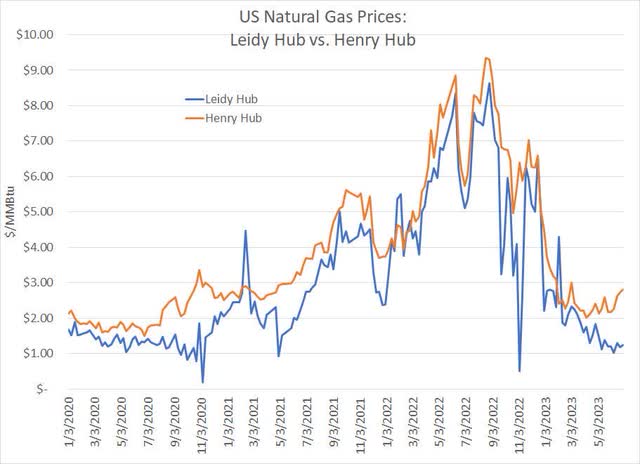
Leidy and Henry Hub Gas Prices (Bloomberg)
The Leidy Hub is located in northern Pennsylvania and, as you can see from my chart, natural gas prices in this region tend to be significantly lower than gas priced for delivery to the Henry Hub in Louisiana.
The latter is the official delivery point for NYMEX gas futures and is located proximate to a major demand center including Gulf Coast refiners, fertilizer and chemical producers that use significant quantities of gas, as well as liquefied natural gas (LNG) export terminals.
In RRC’s case, the company uses firm transport capacity on interstate pipelines to sell around 25% of its natural gas to the Gulf Coast, 25% directly for LNG export, 30% of gas to the Midwest and just 20% to local and Northeastern markets.
That’s why its transport costs are relatively high; the payoff is that by moving most of its production out of the region, its gas price realizations are higher allowing RRC to capture more value for output.
Despite the higher transportation costs, RRC is still one of the lowest cost producers in the US thanks to its cheap-to-produce acreage and prolific wells. All told, I calculate the company’s all-in cash cost of production at just $2.78/Mcfe in Q1 2023.
And remember, that’s not the price of natural gas per mcf, but the price of natural gas, NGLs and oil RRC produced when converted to thousands of cubic feet equivalent production.
The last point to note about Q1 is that RRC’s margin was $1.22/Mcfe, which represents the value per Mcfe sold at $4.00 less that cash cost of $2.78/Mcfe. If we multiply that margin by total Q1 production of 192.8 Bcfe, we derive a free cash flow estimate of about $235 million.
In Q1 2023, RRC reported free cash flow (excluding working capital benefit) of around $248 million with the difference due to some ancillary and one-off gains that aren’t captured by my production and price-focused model.
Bottom line, the model estimated Q1 2023 free cash flow well, so let’s step the analysis forward and create a model for full year 2023 cash flow as well as rough estimates for 2024 and 2025.
Costs and Production Guidance
As part of RRC’s Q1 2023 earnings release and conference call, the company offered updated guidance for full-year production and costs.
For each category, management offered a range of expectations, and this table presents the mid-point of guidance:
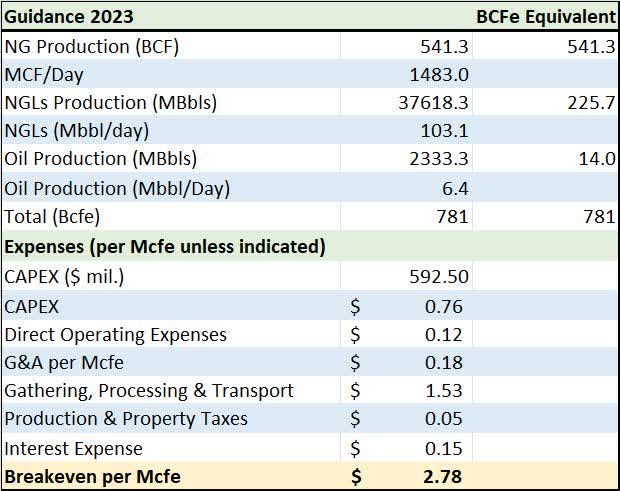
RRC 2023 Cost and Production Guidance (Range Resources Q1 2023 Earnings Release)
I covered most of the salient line items on this table in discussing RRC’s performance in Q1 2023, so I won’t repeat all that analysis here. For the most part, management’s guidance for the full year is in line with their Q1 2023 performance and I calculate the exact same breakeven cost as in Q1 of $2.78/Mcfe.
I made only one minor assumption.
Management only offered guidance for total Bcfe production for the year and did not break out specific expected production volumes for oil, gas and NGLs. However, management did guide to producing approximately 30% liquids for 2023 as a whole, so I used their total production guidance and backed out estimates for oil and NGLs production based on the actual mix of output in Q1 2023.
That works out to 6,400 bbl/day of oil production (14 Bcfe for the full year) and 103,100 bbl of NGLs output per day (225.7 Bcfe for 2023) representing about 1.9% and 28.9% of total production on an energy equivalent basis respectively.
Of course, estimating realized prices for all three of the commodities RRC produces is a more complex task:
Realized Oil Prices
Crude oil isn’t a very important commodity for RRC, accounting for less than 2% of volumes produced, so I’ll keep this section short.
Management’s guidance is for the company’s oil production this year to be sold for a roughly $9 to $13/bbl discount to the price of West Texas Intermediate (WTI) crude oil. So, the mid-point there is an $11/bbl discount to WTI.
On top of that, RRC’s Q1 2023 10-Q report shows the company has hedged 5,000 bbl/day of expected oil production covering the 9-month period from Q2 2023 through Q4 2023 using swaps based on the price of WTI at a price of $71.28/bbl.
So, we know RRC produced 573,000 bbl of oil in Q1 2023 and sold that oil at a price of $62.96/bbl including all discounts and hedges. Based on the mid-point of management’s guidance we also know that the company expects to produce a total of about 2.33 million barrels of oil for full year 2023.
Of course, we also know the average price at which WTI traded in the months of April, May and June (Q2 2023) was $73.80/bbl. For the final 6 months of the year I used the average price of oil so far in July and the current calendar strip for the months of August-December – the strip is nothing more than just the average price of oil for futures that expire in the months of August through December 2023.
So, my estimated realized price for WTI in the final 9 months of 2023 comes to around $71.50/bbl. The mid-point of management’s guidance is for it to sell its oil at an $11/bbl discount to WTI, so I’m using an average realized price of $60.50/bbl.
That leaves the matter of the company’s hedges, which are based on the price of NYMEX-traded WTI crude oil futures, NOT the realized price RRC gets for its barrels.
RRC’s hedges are significant in volume terms (it’s nearly 80% hedged on oil volumes), but the average price for its hedges is $71.28. That’s pretty much in line with my $71.50/bbl estimate for NYMEX in the final 9 months of 2023, so that leaves little need to adjust the realized price of oil for any benefit or headwind from the hedges.
In addition to that, it’s not worth building out the model with too much granularity on the oil side since crude accounts for a paltry 1.8% of the company’s expected production this year.
All-told, I calculate RRC’s full year 2023 realized oil price at $61.10/bbl.
Let’s move on to the NGLs line:
Natural Gas Liquids (NGLs)
Accounting for almost 30% of output by volume, RRC has more exposure to NGLs than other gas-focused E&Ps in my coverage universe.
Most producers offer guidance on expected NGLs prices in terms of WTI prices. For example, guidance for realized NGLs prices at 25% to 35% of NYMEX oil prices over the course of 2023 is common guidance for most E&Ps I follow.
Given the importance of NGLs to RRC’s investment case, perhaps it should come as little surprise the company offers considerably more detail. Specifically, RRC breaks down each barrel of NGLs produced as follows:
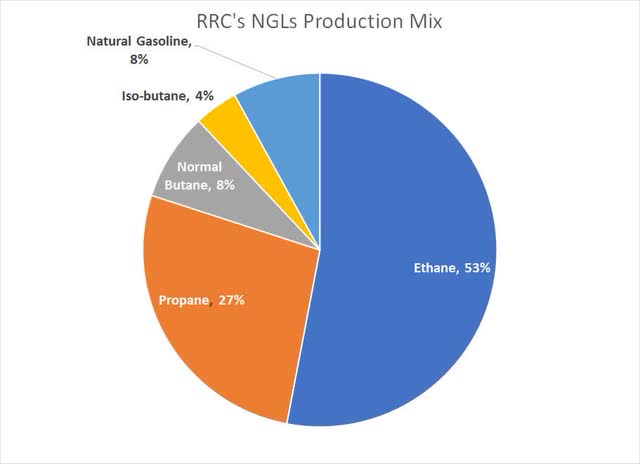
RRC’s NGLS Barrel Breakdown (RRC Q1 2023 Earnings Release)
Methane (natural gas) is a single carbon atom bonded to 4 hydrogen atoms (CH4), while ethane consists of two carbon atoms bonded to 6 hydrogen atoms (C2H6). The other hydrocarbons in a barrel of NGLs simply consist of longer chains of carbon and hydrogen atoms including propane (C3H8) and butane (C4H10). Natural gasoline’s exact chemical composition varies, but it’s so named because it shares properties with gasoline refined from oil.
Each of these hydrocarbons have different uses and values. For example, ethane is normally the least valuable NGL by volume and it’s primarily used to produce ethylene, which is in turn used in the manufacture of plastics. Sometimes, when ethane prices are low, producers leave significant ethane volumes in the raw natural gas (methane) stream to be used in power generation or heating applications with natural gas. That’s known as “ethane rejection” because the cost of removing ethane from gas via processing and fractionation exceeds the value of the commodity.
Most consumers are likely familiar with propane – you might even have a grill, heater or generator that runs on propane – however it’s also used in the production of certain chemicals and for drying crops.
Thanks to expansion of US propane export terminal capacity, the nation is also a massive exporter of propane and propylene, a chemical that’s produced from propane. Indeed, in March of this year, US propane/propylene exports reached a record high of 1.7 million barrels per day and the four-week moving average of exports is trending steadily higher:
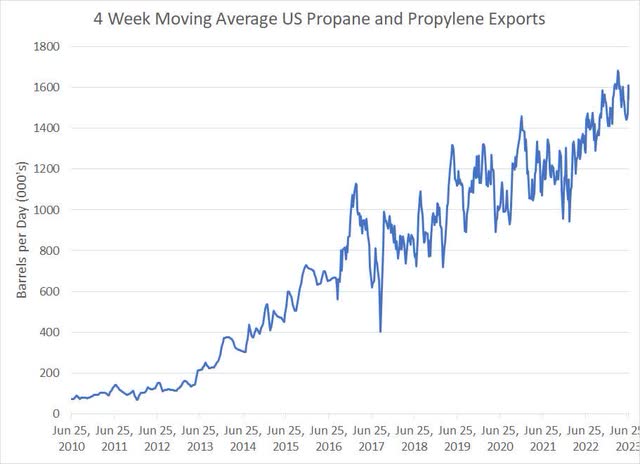
US Propane and Propylene Exports (Energy Information Administration (EIA))
According to EIA, the largest importers of US propane are Japan, China and South Korea and much of that supply is used in the production of chemicals and plastics.
In China, 7 new propane dehydrogenation (PDH) units – facilities used to convert propane to propylene, a raw material in plastic production – opened in 2022 and an additional 6 are slated to open this year, resulting in the need for reliable propane feedstock supply.
According to the International Energy Agency (IEA), another growing market is India where total demand for NGLs (particularly propane) is projected to increase by 50% from 2020-2030. One major driver of this is that IEA estimates 13% of India’s primary energy consumption in 2020 was biomass (primarily wood) used for both heating and cooking. There’s a significant push underway to increase availability of propane as a cooking fuel across India as it’s a healthier, cleaner, and more efficient fuel.
Within the US domestic market, demand for NGLs is driven primarily by industrial end-uses. According to EIA, in 2021 the total demand for NGLs in the US was 3.41 million bbl/day of which 2.91 million bbl/day (85%) was used in the industrial sector including petrochemical production, refining, agriculture and manufacturing industries.
The bottom line for all this is that the long-term outlook for US natural gas liquids (NGLs) demand and exports is strong, but there are some questions about the near-term. That’s because industrial demand for all hydrocarbons – oil, natural gas and NGLs – is historically sensitive to the health of the economy, so a US recession or significant slowdown would have a chilling impact on NGLs demand and prices.
To account for this risk, it’s important we use a relatively conservative price outlook for US NGLs pricing in valuing RRC.
The good news is that futures markets exist for every hydrocarbon in RRC’s NGL barrel mix, so we can construct a price history for RRC’s output while using the futures curve to create realized pricing estimates for NGLs over the next few years.
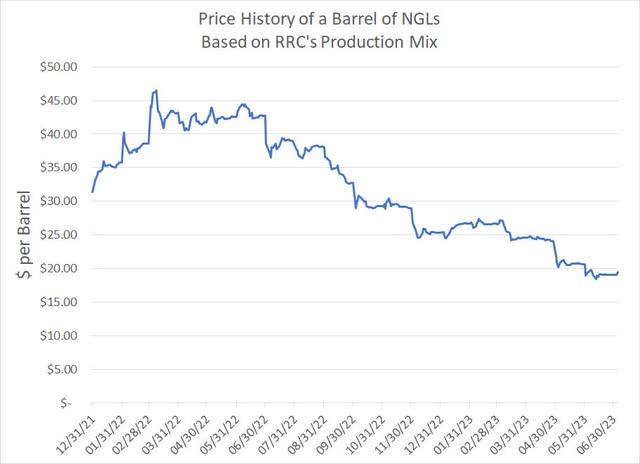
RRC NGLs Price per Barrel (Bloomberg)
Here’s a look at a price history of a barrel of RRC’s NGLs since the end of 2021 – it’s based on the NYMEX futures prices for each product converted to a $/bbl basis (the futures are traded in $/gallon) and multiplied by the production mix outlined in my pie chart above.
All futures for these NGLs products are priced for delivery to Mont Belvieu, located in Texas close to the city of Houston. RRC’s main production assets aren’t in Texas though, historically, RRC has realized a price for NGLs of -$1.00 to +$1.00/bbl of the mixed barrel pricing I just outlined and that’s management’s guidance for 2023. The midpoint of that guidance is $0, so I’m assuming no realized pricing discount (or premium) for NGLs production going forward,
RRC also doesn’t hedge NGLs output with swaps or hedges, so that’s not a factor in our pricing realization estimates either.
With these points in mind, my realized pricing estimates for RRC’s NGLs output for 2023 are constructed in a similar manner as for crude oil. Specifically, we know the company produced 9.289 million barrels of NGLs in Q1 at a realized price of $27.60/bbl and our full-year estimate for NGLs output is 37.62 million barrels.
The average price of the RRC NGLs barrel I constructed above was $21.03/bbl in the second quarter of 2023 and the futures for delivery for the remainder of this year come to roughly $20.80/bbl.
So, my weighted average realized pricing marker for RRC’s full year 2023 NGLs barrels is $22.66/bbl all-in.
One more chart related to NGLs:
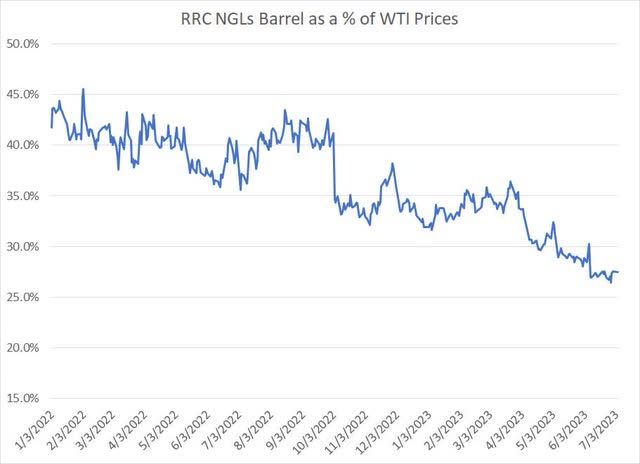
Price of NGLs as a Percentage of WTI (Bloomberg)
As I noted earlier, management teams at many E&Ps simply guide for realized NGLs pricing as a percent of the price of a barrel of WTI crude oil.
This chart shows the history of a barrel of RRC’s NGL’s as a percentage of front-month WTI futures prices since the end of 2021. As you can see, NGLs prices have been trending lower relative to crude oil over this time.
There are several reasons for this including that OPEC’s efforts to curtail oil production support oil prices, but don’t have a similarly bullish impact on NGLs pricing. A second major reason is that ethane –more than half of a barrel of RRC’s NGLs – tends to track the price of natural gas more closely than oil and, due to short-term factors I’ll outline in a moment, gas prices have been weak this year.
Regardless, we’re using futures calendar strip pricing to create a realized price estimate for RRC’s NGL’s production, so it’s worth doing a quick check to make sure these prices are reasonable relative to current pricing in the oil futures market.
Specifically, as of early July, the price of a barrel of RRC’s NGLs was roughly 27.5% of a barrel of WTI oil. For the remainder of 2023, my model assumes RRC’s NGLs priced at about 28% of a barrel of oil and 2024 NGLs strip pricing is at around 30% of WTI’s 2024 calendar futures strip.
So, there’s no major recovery in NGLs pricing baked into my 2023 and 2024 realized pricing estimates for NGLs, rather a general return to roughly the lower end of the long-term average at 30%. That represents a reasonable and conservative assumption in my view with some upside potential if natural gas and ethane prices improve going forward as I expect.
So, let’s look at natural gas.
Natural Gas Realized Pricing
While NGLs production is an important piece of RRC’s valuation, the company’s largest single product is natural gas, accounting for almost 70% of production volume on an mcfe basis in Q1 and 62% of the value of every thousand barrels of gas equivalent production (mcfe).
In the spring of this year, US natural gas prices broke down to around $2/MMBtu, which represents the lowest price since the 2020 COVID lockdown-driven collapse in commodity prices. From the closing peak over $9.60/MMBtu in August 2022 to the lows this spring, US gas prices slumped roughly 80%.
The good news is that this collapse in gas prices was primarily driven by two shorter-term factors – a warm winter of 2022/23 that crimped demand for gas heating and a fire at the Freeport liquefied natural gas (LNG) export facility in Texas in June 2022. Since the Freeport facility was off-line from mid-June 2022 through to March of this year for repairs, this fire led to the loss of around 2 bcf/day of US gas exports, “trapping” additional volumes in the US market.
As I outlined in a recent article on Seeking Alpha “United States Natural Gas Fund: Much Better Ways to Go Long Natural Gas,” the outlook for the commodity is already getting brighter.
A hot start to the summer of 2023, coupled with low natural gas prices, is driving an increase in demand for gas from the power generation sector, particularly aimed at producing electricity for air conditioning. Meanwhile, lower gas prices have prompted a significant drop in the US gas-directed rig count – Baker Hughes reports there were 135 rigs drilling for natural gas as of July 7th, down from 161 active rigs at the end of April.
Production from more price sensitive plays, such as the Haynesville Shale of Louisiana, appears to be rolling over based on pipeline data collected by Bloomberg:
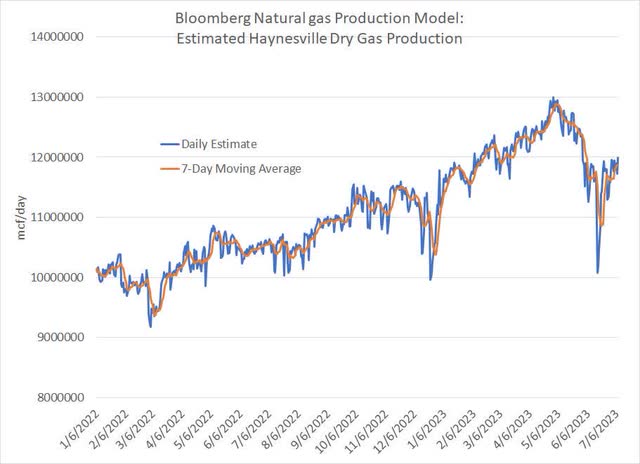
Estimated Haynesville Shale gas Production (Bloomberg)
Over time, a falling rig count and reduced drilling activity restrains US domestic gas supply, helping to tighten balances and support prices.
Longer term, the US gas market should also benefit as new US LNG liquefaction plants currently under construction come onstream and begin exporting more gas. That list includes the 2.4 bcf/day Golden Pass terminal in Texas due for startup in the second half of 2024, the 1.8 bcf/day Plaquemines facility in Louisiana in 2024/25 and an expansion of a Corpus Christi plant in Texas that will contribute 1.6 bcf/day of additional export potential.
Between the end of this year and 2025 total US LNG export capacity is set to rise from 14 bcf/day to 20 bcf/day.
To estimate realized pricing for RRC’s gas production for the remainder of 2023, 2024 and 2025, I’m simply using the current calendar strip pricing baked into the natural gas futures curve:
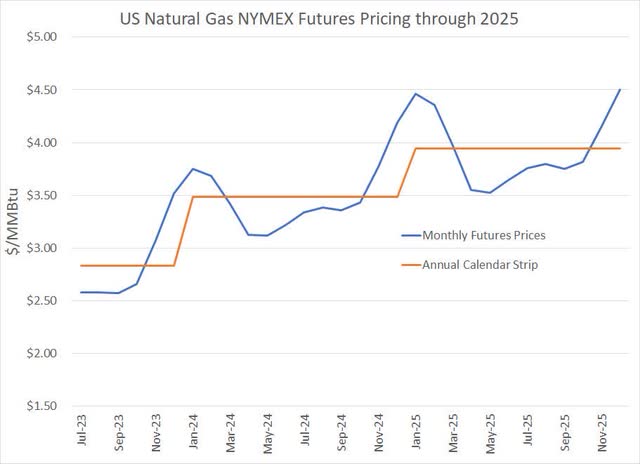
US Natural Gas Price Curve (Bloomberg)
There are two features of the US NYMEX gas futures curve (the blue line). First, there’s the seasonal variation in prices; natural gas prices for delivery in winter months are higher due to elevated seasonal demand for heating.
Second, there’s a distinct upward slope to the gas futures curve, a shape known as contango. This is due to the fact that natural gas prices are depressed today due to the short-term factors I just outlined but are expected to recover into 2024 and 2025 as weather conditions normalize and amid the start-up of new LNG export capacity.
Thus the average price of gas baked into the curve through the remainder of 2023 is $2.83/MMBtu, rising to $3.48/MMBtu in 2024 and $3.94/MMBtu in 2025.
Also, it’s important to understand these aren’t just estimates – RRC can and does lock in significant volumes of expected production at similar prices using hedges. Hedges in the second half of 2023 and early 2024 will help protect near-term cash flows and sets the company up well to benefit from the longer-term recovery in gas prices.
So, my realized pricing estimates for RRC’s gas production for 2023 consists of the company’s first quarter production for which it realized a price of $3.58/mcf including all hedges. For Q2 2023 I’m using the average NYMEX price of gas futures for the months of April-June and for the balance of 2023 it’s based on the gas futures strip curve I just outlined.
Two additional wrinkles.
First, the mid-point of the company’s guidance is that it will sell its gas at a $0.40 discount to the NYMEX futures price. Primarily that’s due to the fact RRC sells significant volumes in the local market and into the MidWest, where prices tend to be lower than on the Gulf Coast (Henry Hub). So, I account for that by simply subtracting $0.40 from the strip pricing I just calculated.
Finally, there’s the company’s hedge book reported in its Q1 2023 filing with the SEC. Simply put, RRC has hedged about 217 bcf of gas production from April through December 2023 using a combination of swaps, put options collars.
Since guidance calls for total 2023 output of 541.3 bcf and the company produced 133.6 bcf in Q1, this represents hedges covering more than half of expected production through year-end at prices well above the current strip.
So, here’s how I accounted for that:

Impact of RRC Natural Gas Hedges (RRC Q1 2023 10-Q)
As you can see, the company’s remaining hedges add about $0.33/mcf to gas price realizations for RRC’s full-year 2023 production and chip in an additional $0.11/mcf for 2024.
Price Target, Valuation and Risks
Earlier on in this article, I estimated RRC’s cash flow breakeven for 2023, including all CAPEX, at $2.78/mcfe and here’s a look at the price realization estimates I just outlined:
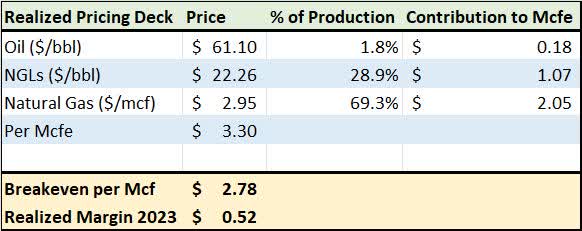
Realized Commodity Pricing Estimates for 2023 (RRC Q1 2023 Earnings Release and Guidance)
As you can see, I estimate the full-year all-in realized prices including hedges at $3.30/Mcfe, which offers a $0.52/Mcfe cash flow margin over RRC’s breakeven costs of $2.78/Mcfe.
If we multiply that margin by expected production for the full-year we can derive a rough estimate of total company free cash flow for 2023 of approximately $405 million.
Per Bloomberg, the consensus on Wall Street is for all-in 2023 free cash flow that’s higher than that at $540 million. I suspect there are a number of reasons for that difference; chief among those is that some of the estimates baked into the consensus are “stale,” published after RRC reported quarterly results in late April.
In late April, NGLs prices in particular were above $24/bbl compared to under $20/bbl today; even if I adjust my realized pricing for NGLs in 2023 higher by just $2.50/bbl, my estimate of RRC’s free cash flow margin jumps to $0.64/Mcfe and the estimate for free cash flow increases to north of $500 million.
Assuming costs and total production remain roughly unchanged, we can also use the futures strip pricing for next year to estimate cash flow breakeven and free cash flow estimates for 2024 and 2025 as well:
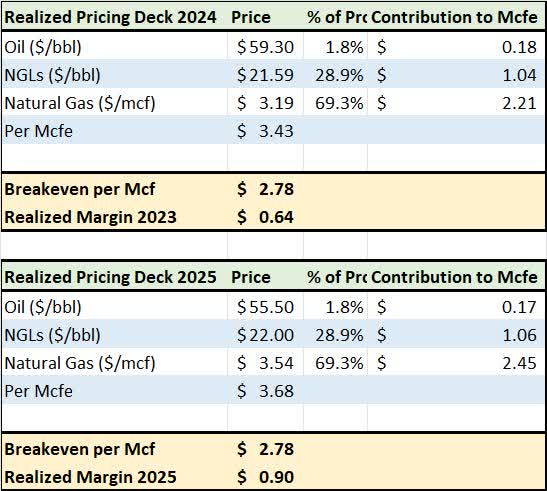
Pricing and Margin Estimates for 2024 and 2025 (Bloomberg, RRC Q1 2023 Report)
As you can see, just based on current calendar strip pricing for futures in 2024 and 2025, RRC’s margins increase to $0.64/Mcfe in 2024 and $0.90/Mcfe in 2025, resulting in rough estimates for free cash flow of $500 million and $700 million respectively.
Wall Street estimates are higher than that at $750 and close to $900 million so, again, I see this outlook as conservative. Also, keep in mind that in 2023 RRC is spending only what’s known as maintenance CAPEX – enough money to maintain equipment and production with no growth.
Should natural gas and NGLs prices recover as I’d expect and the futures curve has priced in, it’s likely RRC would seek some growth in output. Higher output would tend to boost free cash flow.
Of course, deriving a fundamental target price is an exercise fraught with assumptions, but let’s consider the potential upside in the stock based on a simple discounted cash flow analysis:

DCF Price Target for RRC (Bloomberg, Author’s Estimates)
To create this table, I’m using the free cash flow estimates for 2023, 2024 and 2025 I derived earlier. For 2026 and 2027, I’m penciling in free cash flow of $900 million per year, which is based on a long-term oil price assumption of about $80/bbl and a mixed barrel of NGLs selling for about $25/bbl and natural gas averaging $4/MMBtu. I am assuming no growth in free cash flows beyond 2028; RRC has 20+ years of drilling inventory at the current rate of production.
I’m using a weighted average cost of capital (WACC) of 8.5% as the discount factor, which is based on a Bloomberg model that includes the actual cost of RRC’s debt coupled with the volatility in the stock relative to the S&P 500 over the past 5 years.
Under those assumptions, the DCF share price valuation jumps to $35.50, about a 25% premium to the recent closing price.
I must stress that I believe that target to be on the (very) conservative side.
If, for example, we maintain current estimates for 2024 and 2025, but assume WTI oil prices recover to $85/bbl by 2026 ($74 for RRC after factoring in that $11/bbl pricing discount),NYMEX natural gas averages $4/MMBtu (less a $0.40/mcf discount for RRC) and NGLs trade to $27.50/bbl (32.5% of that WTI estimate, below the long-term average range) then the annual cash flow estimate jumps to $1 billion per year.
Plugging in that estimate for 2026 and thereafter pushes the target to above $40 per share, implying more than 40% price upside from the current level.
I believe commodity price realizations of that magnitude are reasonable longer term. As I highlighted in my July 6th piece “Oil’s Recession Warning,” crude oil prices are currently depressed mainly due to concerns about a possible recession.
However, longer term, Saudi Arabia needs Brent oil prices around $81/bbl just to balance its budget; near-term cyclical issues aside, WTI oil prices are likely to average well above $70/bbl by 2026, which is the level currently factored in to the calendar strip price and my base case model estimates.
While oil itself isn’t particularly important to RRC’s valuations, a mixed barrel of NGLs currently trades at just 27.5% of the value of WTI, well below the long-term average. Part of that is concerns about a recession and the resulting hit to industrial NGLs demand. A recovery to $27.50/bbl for NGLs by 2025-26 is well within the scope of historic norms for these commodities.
Of course, there are also downside risks to my target.
The biggest is a continued slump in natural gas and NGLs prices. For natural gas the risk is that there’s an additional warm winter in 2023/24, resulting in continued high storage and the need for further production cuts from US producers to restore the market balance.
And, of course, a global recession could keep the lid on NGLs prices into 2024, though my base case model factors in very little upside from current levels as currently structured.
I see continued sub-$3 natural gas and depressed NGLs prices as a low probability risk however, it could impact RRC’s ability to generate cash flow this year and next in a worst-case scenario.
A second meaningful risk is ongoing cost inflation. With commodity prices soaring in 2022, the cost of all sorts of basic services from completing and fracturing wells to drilling new wells and labor rose, and that impacts RRC’s margins.
Based on the company’s guidance, they have the situation well in hand and it also helps that RRC is among the least capital-intensive producers around – the company doesn’t have to drill aggressively to maintain production, so it’s less exposed to cost inflation than more capital-intensive producers in plays like the Haynesville.
Further, the most likely cause of a jump in cost inflation would be increased drilling activity that forces oil and gas service providers to raise prices. Generally, that happens when commodity prices are strong, so it’s likely higher-than-expected cost inflation would be at least partly offset by higher commodity prices than are currently anticipated in my model.
Nonetheless, cost inflation has been, and is likely to remain, a risk for all E&Ps.
Bottom line: As I’ve outlined there are significant risks and calculating a valuation target is never exact science; however, even with modest commodity and cash flow assumptions, I see 25% upside to RRC to my most conservative target. Upside to over $40 is entirely reasonable given only slightly more aggressive pricing assumptions.
RRC also provides a useful diversification benefit for those building a portfolio of energy companies. That’s because of the company’s heavy exposure to the often-overlooked NGLs market.
Per IEA’s estimates, demand growth for NGLs globally is expected to remain among the strongest of any hydrocarbon over the next few years and the US is well-placed to grow exports to fill that demand.
RRC is one of the lowest cost producers in the US (and the world) with solid leverage to a recovery in both NGLs and natural gas prices.


