Electricity prices are rising, and not just in places where they are already high but nationwide, according to Retail Electricity Price and Cost Trends: 2024 Update, a recently released report from the Lawrence Berkeley National Laboratory (LBL). It summarizes trends in retail electricity prices and price drivers for the period 2019 through 2023 by examining average retail electricity prices, retail sales, utility revenues and capital expenditures, operations and maintenance (O&M) costs, fuel and purchased power costs; and the impact of recent developments in the so-called behind-the-meter (BTM) resources.
|
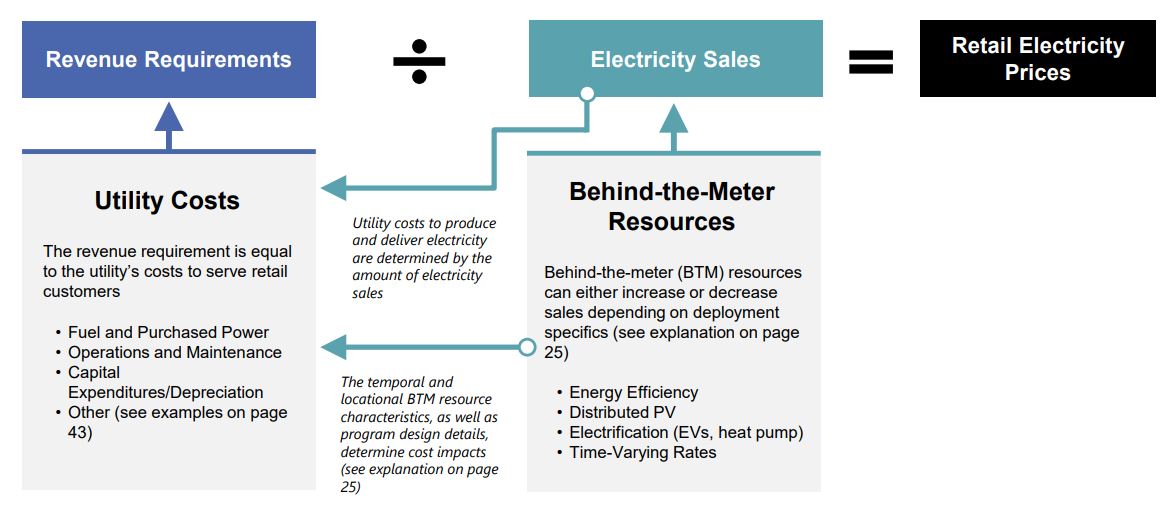
Revenue requirements: Are regulated utilities complacent? Source: Retail Electricity Price and Cost Trends: 2024 Update, Lawrence Berkeley National Laboratory, Dec 2024 |
The report’s key findings – our words not theirs – are
- Retail electricity prices did increase from 2019 to 2023;
- Delivery, especially distribution costs, appear to be the main driver;
- Load growth during this period was not a major driver; and
- As customer investments in behind-the-meter (BTM) resources continue to grow, they are becoming a significant factor in determining ultimate prices.
|
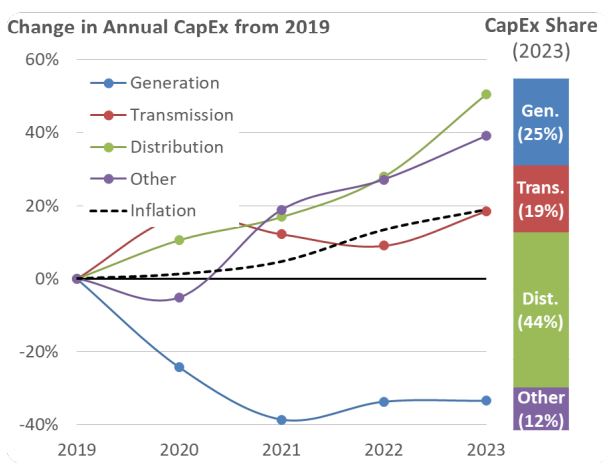
Distribution investments are the biggest component of CapEx
Source: Retail Electricity Price and Cost Trends: 2024 Update, LBL, Dec 2024 |
The LBL report concludes that on a nominal basis, average retail electricity prices in the US increased 2.5% per year from 2014 to 2023 with most of this concentrated in 2019-23 period where they rose 4.8% annually. Taking inflation into account, retail electricity prices were basically unchanged rising faster than inflation for residential customers.
During this period collected revenues – or revenue requirements – increased by more than 20% while retail sales remained flat. This is consistent with the message in PG&E’s love letter, which appeared in the previous issue of this newsletter. As PG&E’s CEO explained, when sales are flat and costs rise, so do the retail rates, all else being equal under the established regulatory regime.
Not surprisingly, the LBL report highlighted steady rise in capital expenditures (CapEx) in the distribution infrastructure – growing by 50% over 2019-2023, more than double the rate of inflation (visual above). It highlighted distribution as the largest source of utility CapEx, roughly 44% of the total in 2023 and noted,
“Similarly, distribution operations and maintenance (O&M) costs have grown the most since 2019….”
|
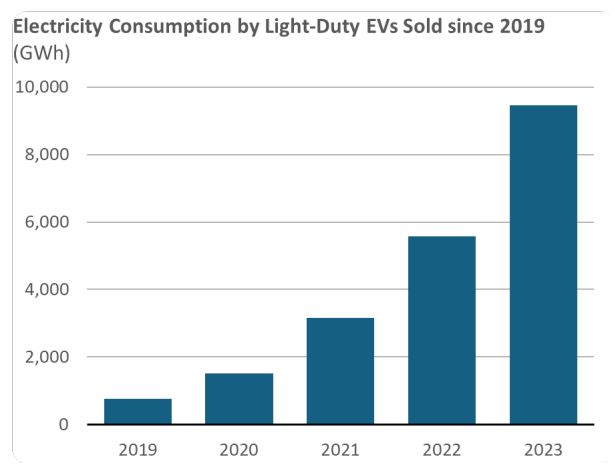
Electricity consumption of EVs is steadily rising
Source: Retail Electricity Price and Cost Trends: 2024 Update, LBL, Dec 2024 |
Other cost drivers where fuel and purchase power, which fluctuate primarily with natural gas prices, which currently comprise roughly 40% of the US electric generation mix.
According to the LBL report, load growth was not a factor since retail electricity sales were virtually flat from 2019 to 2023. This, however, is likely to change as retail sales are projected to rise in the coming years as further explained in article on page 16.
On the issue of customer investments in behind-the-meter (BTM) resources, also called distributed energy resources (DERS), the LBL report examined the impact of energy efficiency, distributed solar PV, electric heat pumps, and electric vehicles.
|
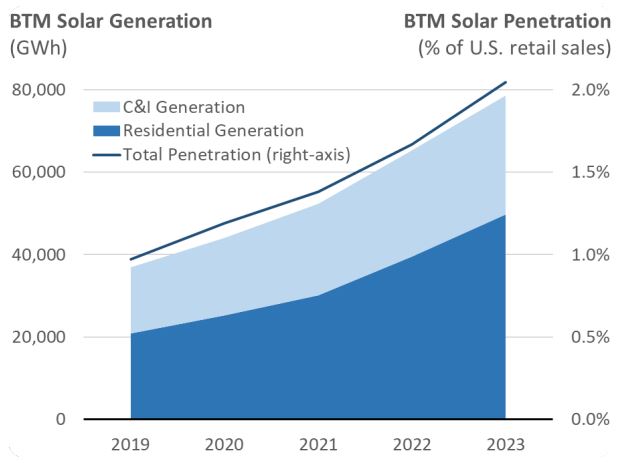
Rooftop solar represents 2% of US retail sales
Source: Retail Electricity Price and Cost Trends: 2024 Update, LBL, Dec 2024 |
It notes that in absolute terms energy efficiency efforts including utility ratepayer-funded energy efficiency programs and federal appliance energy efficiency standards resulted in loss of roughly 250,000 GWh of sales. On a percentage basis, the electric vehicle load grew the most at more than 400% between 2021-23, albeit from a small base.
The LBL report points out the obvious, namely that some BTM assets increase while others decrease consumption. It says BTM resources “… can either increase or decrease utility retail sales and costs depending on the specific BTM resource (e.g., energy efficiency can dampen load growth and electric vehicles can accelerate load growth) and where on the grid they are deployed.”
BTM solar, including all types of distributed solar on residential, commercial and industrial sites, resulted in 40,000 GWhs or 2% of sales loss at national level in 2023 and is currently concentrated among a handful of states. As covered in the preceding two articles, this is merely the tip of the iceberg as more customers install solar panels especially in sunny regions with high retail rates.
Currently roughly 70% of the BTM solar is on residential roofs, but commercial and industrial customers are expected to follow as will municipal and agricultural customers, parking lots and others.
|
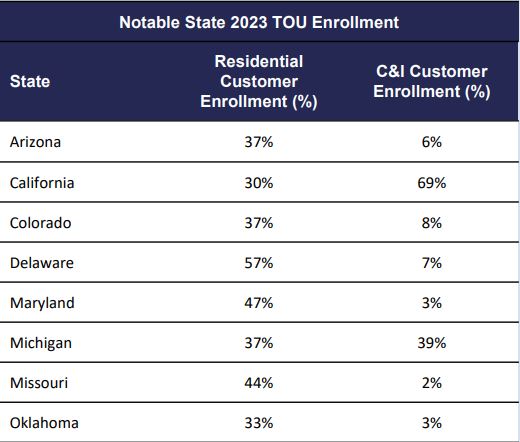
Time varying rates are spreading, slowly
Source: Retail Electricity Price and Cost Trends: 2024 Update, LBL, Dec 2024 |
The solar’s projected rise reduces utility sales while EVs can increase – or potentially decrease – it, depending on when, how and where they are charged or potentially discharged. Bidirectional EVs, for example, can enhance the economics of self-generation by offering expanded storge capacity.
In either case, the utilities and their regulators are belatedly rising to the challenge of better managing demand by balancing the variability of renewables with demand flexibility. This, of course, can best be achieved through variable electricity pricing, which is on the rise in many states (table above).
The BTM resources, not unlike the utility-scale solar resources, are the cause of pronounced fluctuations in generation and consumption, which result in massive price swings in the wholesale markets depending on the circumstances. Variable retail prices can unleash demand flexibility countering many harmful aspects of these price swings. n
This article originally appeared in the April 2025 issue of EEnergy Informer, a monthly newsletter edited by Fereidoon Sioshansi who may be reached at fpsioshansi@icloud.com”


