It is not an art to analyse a price movement on the basis of its historical fluctuations – after all, we can always fit any theory to them. It is enough to look for double-bottom or head-and-shoulders formations, to look at exponential moving averages or to determine demand and supply zones to “confirm” a given hypothesis.
I believe that the real difficulty in market analysis lies in predicting future price behaviour with the assumption that “the market discounts everything”. In practice, this requires looking at fundamental, macroeconomic and regulatory issues, as well as understanding investor psychology and correctly interpreting signals from technical analysis.
And this is exactly what I do – I help my clients understand how various factors affect the market, identify zones of potential opportunity and risk and, as a result, create multi-dimensional price forecasts.
In September, one of them asked me to carry out a broad analysis of the energy market, an important part of which was to forecast the price movement of CO2 allowances until the end of this year.
I presented my conclusions in a report in which I took into account both the fundamentals, the regulatory situation, the macroeconomic context and the technical side of the market.
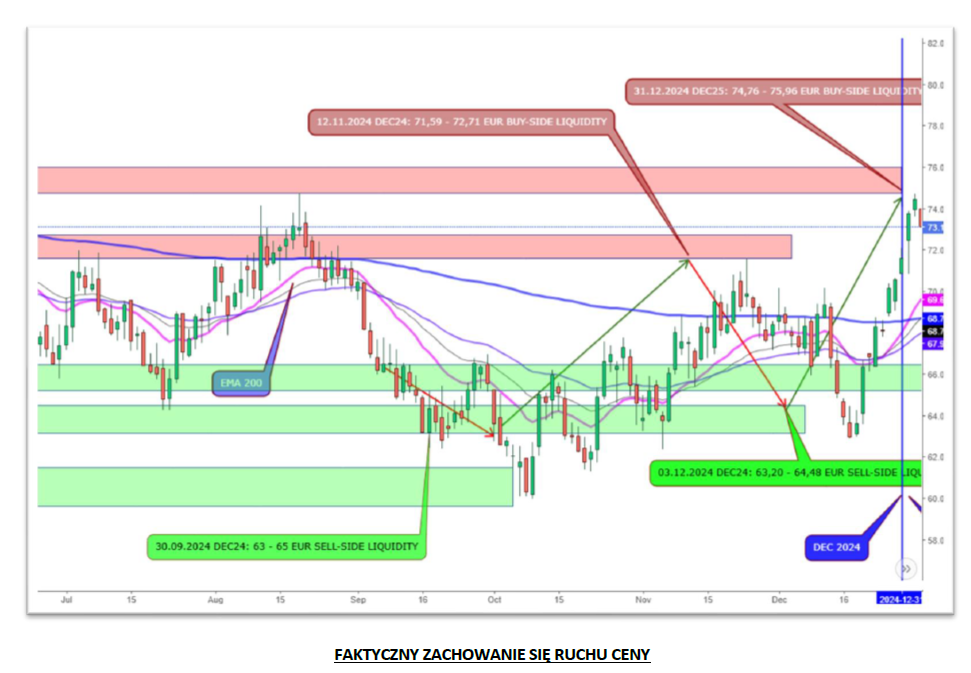
I am enclosing two graphs:
– the first is from the September report,
– the second shows the current state of the market after four calendar months.
As you can see, the prediction was very accurate, predicting the main trends and support and resistance zones in such an unpredictable and difficult market as the CO2 allowances market.
If you would like to see how professional and multidimensional energy market analysis (including the CO2 market) can be, I invite you to contact me – I would be happy to tell you more about my methods and conclusions.


