In August 2022, when the Inflation Reduction Act was signed into law, it became the most significant investment in climate that the United States has ever made, making long-term, transformational investments in clean energy deployment, manufacturing, electric vehicles and buildings, and targeted investments to support communities disproportionately impacted by our energy system.
America’s electricity sector is the IRA’s cornerstone, making up 30-44% of the bill’s expected economy-wide emissions reductions. Now, two years after the IRA’s passage, signs of progress are emerging.
Before the IRA passed, clean electricity incentives were caught in a cycle of short-term extensions and expirations, creating enormous clean energy industry uncertainty. The IRA invested in the clean energy industry’s long-term economic health by creating a decade’s worth of certainty for electricity providers, developers, and investors solidifying that clean energy was the better deal for electricity consumers, shareholders, and the planet.
The IRA owes its name to the era of rising prices in which it passed. Global fossil fuel price volatility and supply chain constraints were driving up inflation and interest rates. With clean energy costs largely coming as upfront capital expenditures, the industry was in a period of moderating growth when the bill passed.
Key policies included extension and expansion of clean electricity tax credits, providing up to 60% off the cost of clean energy for ten years, the creation of manufacturing tax credits that bring clean energy manufacturing to the U.S., and billions of dollars to grant and loan programs to make sure upfront funding is there for projects that will save money in the long-term.
A New Energy Era
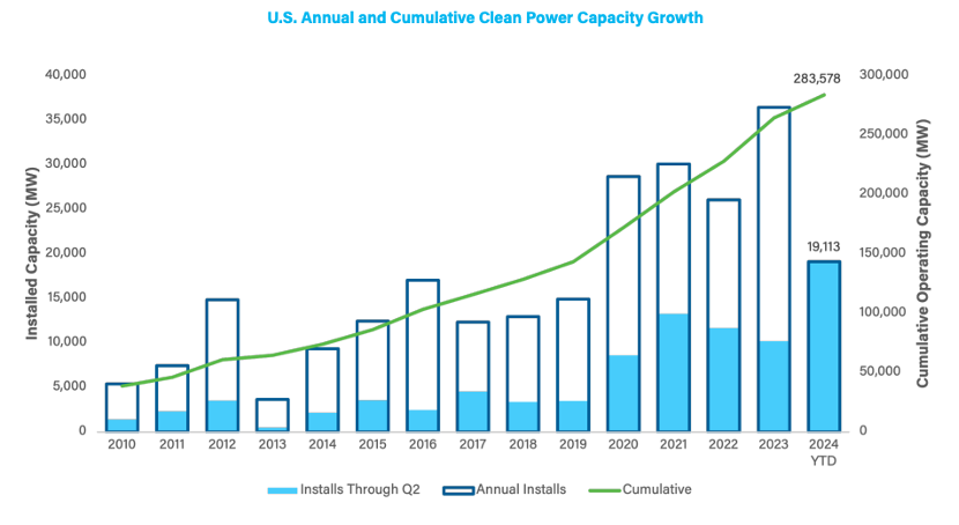
The effect of the IRA has only just begun to show up in clean energy deployment. While the first half of 2023 was still relatively slow on installs of solar, wind, and energy storage, 2023 ended with a new record of over 35 gigawatts of new solar and wind capacity added, and the first half of 2024 saw a 91% increase over installs in the first half of 2023 at 19 GW. Not only were installations in the higher than 2023, but they were 10 GW higher than average of the previous five years. The U.S. Energy Information Agency expects a total of 59 GW of wind, solar and energy storage to come online in 2024. The growth in renewable energy installations is only expected to rise, with planned projects reported to the EIA overwhelmingly comprised of wind, solar, and batteries in coming years.

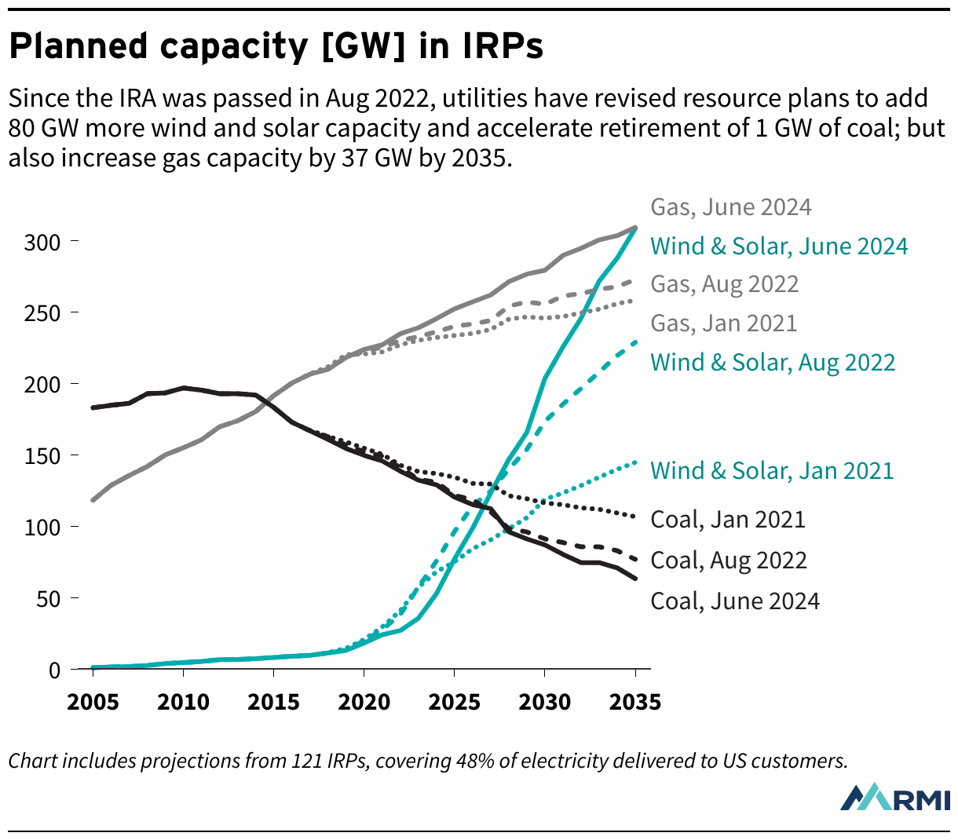
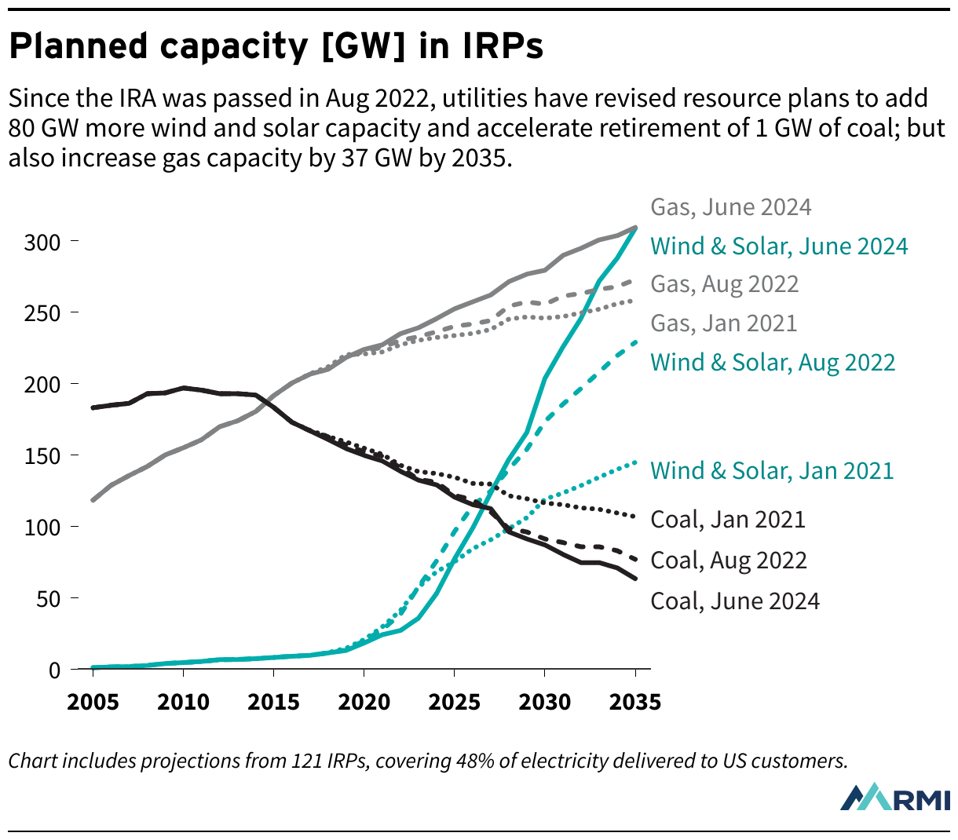
Since 2021, utility plans have also become increasingly bullish on adding new clean energy. An RMI analysis of 121 utilities representing 48% of U.S. electricity demand showed utilities are now planning to add 34% more wind and solar than they were as of August 2022. Unfortunately, plans to add gas have also increased, as utilities respond to rising electricity demand while they work to modernize their planning assumptions. Utilities don’t need to rush to gas, however, as good planning and procurement practices can help utilities meet growing demand with cleaner and cheaper resources.

The IRA extended support for clean electricity across the whole sector, but publicly owned and non-profit electricity providers saw some of the most significant changes. First, tax credits that were previously inaccessible due to lack of tax liability were converted to direct pay, so non-profit entities could take direct advantage.
Rural electric cooperatives in particular are set to receive significant direct funding. Rural electric cooperatives provide electricity to 42 million people across 56% of the nation’s landmass. They serve a disproportionately low-income segment of the population, but lag behind the rest of the nation in moving away from coal power, with 30% of their electricity coming from coal in 2022 compared to 19% nationwide. However, the IRA breathed new life into these non-profit utilities, setting aside $9.7 billion in funds to help cooperatives reduce emissions and install clean energy projects.
The first round of funding announcements into this program were made in September, with $7.3 billion awarded to 16 utilities across 23 states, leveraging an additional $29 billion in private investment. These funds are expected to support 10 GW of new clean energy projects and reduce greenhouse gas emissions from rural electric cooperatives by 43.6 million tons each year, or about 30% of cooperatives current annual emissions. Projects are also expected to reduce electricity rates substantially compared to a continued reliance on fossil energy, according to several of the awardees.
Clean Electricity for Everyone
The IRA didn’t stop at driving new clean energy investment – it sought to create a positive feedback loop between the clean energy transition and the health of American manufacturing via a new set of tax credits that can be earned by producing components that go into clean energy projects.
Since the bill’s passage, manufacturing facility announcements rolled in, with over $112 billion in investment slated for batteries, electric vehicles, solar, and wind. Batteries are by far the largest share of investment at 68%, shared between batteries for the electric grid and for electric vehicles which utilize slightly different chemistries. However, solar manufacturing boasts no small stake with $14 billion in announcements, which will continue to abate supply chain delays that have lingered after the pandemic.
The power of the IRA does not lie in its direct investment alone. The bill’s clean energy provisions also enabled state action with four states implementing 100% clean energy targets for the first time in 2023. Minnesota and Michigan passed legislation requiring 100% of electricity sales to come from clean sources by 2040, while the New Jersey governor signed an executive order requiring 100% clean electricity by 2035. Delaware, too, passed clean energy legislation, requiring a 100% clean economy by 2050.
While interest in clean energy from states, utilities, and investors has increased, many bottlenecks remain, namely in interconnection queues, or the projects waiting to connect to the grid. Research by Lawrence Berkeley National Lab found that at the end of 2022, over 2,000 GW clean projects were waiting to connect, and at the end of 2023, that number had skyrocketed to over 2500 GW. Overall U.S. energy capacity is about 1,400 GW, meaning significantly more projects are waiting to connect to the grid than are currently connected.
Reforms by the Federal Energy Regulatory Commission aim to shorten these wait times and reduce costs, but regional approaches have shown that much more can be done in the effort to connect clean energy projects as quickly as possible. For example, Texas uses an approach to interconnection that avoids lengthy studies and costly upgrades across the transmission grid any time a project wants to connect.
This has reduced Texas’ timeline to connect projects compared to other regions by 2.5 or more years, and shows why the state is predicted to add 35% of all solar projects and 44% of all battery projects this year, despite only producing 13% of the nation’s electricity.
Further improvements to transmission planning, bolstered by recent FERC action, are also expected to prepare the grid to handle more clean energy, faster, but short-term actions like upgrading existing infrastructure to carry more electricity on the transmission pathways we already have can help meet our current needs.
A Clean Power Future
The investment approach of the IRA is not enough to bring electricity sector emissions down to zero – it was never expected to do so. However, it has created tailwinds, bringing industry forward and creating momentum far into the future. Now, it’s time to focus on the next piece of the puzzle and make sure the momentum translates into clean power.
<section content-id="6703e7bff92ef9410d70959a" contenteditable="false" data-grammarly-skip embed-id="2" paste-data="{"id":2,"type":"image","data":{"source":"dam","html":"Chart includes projections from 121 IRPs, covering 48% of electricity delivered to US customers. ","guid":"6703e972dedc0a79b089ed9c","caption":"Chart includes projections from 121 IRPs, covering 48% of electricity delivered to US customers. ","credit":"RMI","width":1220,"height":1070,"cropRatioName":"custom","hasTransparency":false,"alignment":"","imageType":"image/png","altText":"Chart includes projections from 121 IRPs, covering 48% of electricity delivered to US customers.","aspectRatio":87.70491803278688,"author":"2726234","newTabLink":false,"adsDisabled":false,"autoplay":false,"floatingEnabled":false,"pauseAd":false,"secretAutoplay":false,"muted":false,"live":false},"inflatedHTML":"

Chart includes projections from 121 IRPs, covering 48% of electricity delivered to US customers.
RMI
“,”position”:”middle”}”>


