Impact of Gas Price Drop on Operators
Henry Hub gas prices have witnessed a significant decline from their November peak of approximately $3.50 per Mcf, reaching near-record lows of around $1.60 per Mcf. This drastic shift has prompted operators in major gas basins to respond by reducing rigs and, in some instances, voluntarily shutting down production. For instance, EQT announced in early March its decision to shut in 30-40 Bcf of production during the first quarter of 2024.
Concerns in the Industry
Given the persistently low gas prices, there is widespread concern within the industry about the ability of Haynesville operators to generate attractive returns. Many question whether any operators in this basin can achieve profitability in such a challenging environment.
Ranking of Top Ten Operators
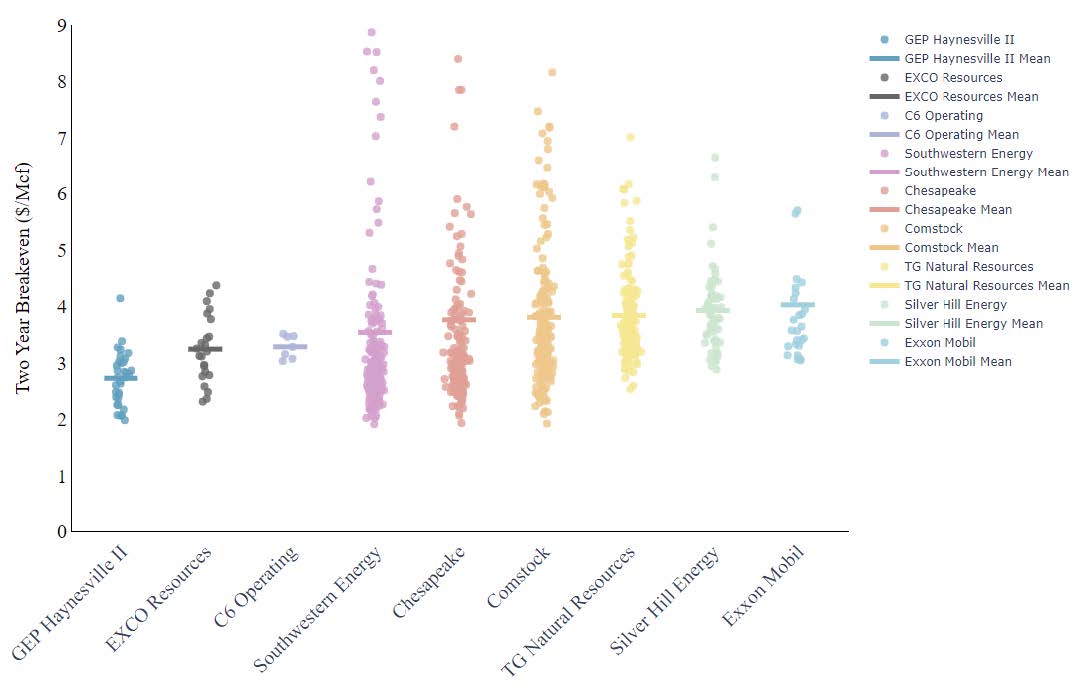
To shed light on this issue, we have compiled a list of the top ten operators in the Haynesville basin based on their breakeven points. Breakeven is defined as the flat Henry Hub price required to generate a two-year payout period, which is colloquially considered the benchmark for achieving a good return on capital for shale wells.
Highlights
- GEP Haynesville II (GEP II) takes the top spot: Among the top ten operators, GEP II ranks the best with a two-year average HH breakeven of ~ $2.70/Mcf, followed by EXCO (~ $3.20/Mcf), C6 Operating ($3.28/Mcf), and Southwestern ($3.53/Mcf). We highlight that none of the operators come close to generating average two-year payouts at sub-$2 gas.
- Sub $2 breakevens are rare: In the last three years, GEP II, Southwestern, Chesapeake, and Comstock drilled only one well each, which we estimate broke even at sub $2/Mcf gas.
- Louisiana outranks Texas on a half-cycle basis: Operators with a more Louisiana-focused asset base tend to have better breakevens and payout periods than peers on the Texas side of the border.
- Implications for Tellurian: Tellurian screens poorly on a 2-year breakeven metric, and we estimate it ranks 18th in the basin. This, coupled with historically low gas prices, will make a successful sale of Tellurian’s upstream assets difficult.
Figure 1. Two-Year HH Breakeven by Operator ($/Mcf) (2021-2024)
(This represents the flat HH price needed for a well to break even in two years. Each dot represents a well)
Source: Novi Insight Engine, Novi Intelligence. Note: All wells with breakevens over $10/Mcf were removed. Only the 2021-2024 vintages were used in this analysis.


