Following my previous story on the pause in U.S. liquefied natural gas exports, some readers had a hard time believing that the U.S. leads the world in reducing carbon emissions. Some suggested this was only true for per capita emissions, or that it isn’t true if you consider methane leaks. But, neither of those comments are accurate.
Per the 2023 Statistical Review of World Energy, over the past 15 years, the U.S. has experienced the largest decline in carbon dioxide equivalent emissions of any country. From the report, this reflects “the sum of carbon dioxide emissions from energy, carbon dioxide emissions from flaring, methane emissions, in carbon dioxide equivalent, associated with the production, transportation and distribution of fossil fuels, and carbon dioxide emissions from industrial processes.” Thus, this includes leak estimates, as explicitly noted in the report.
The U.S. reduced carbon emissions by 879 million metric tons, or 14%. Here’s how that compares to the ten countries with the greatest carbon emission reductions over that timeframe. The numbers are in million metric tons per year.
To be fair, U.S. carbon emissions are higher than any other country’s emissions in that table, so the 14% cut in emissions should be put in context of the UK’s 40% decline or Spain’s 33% decline over the same time period.
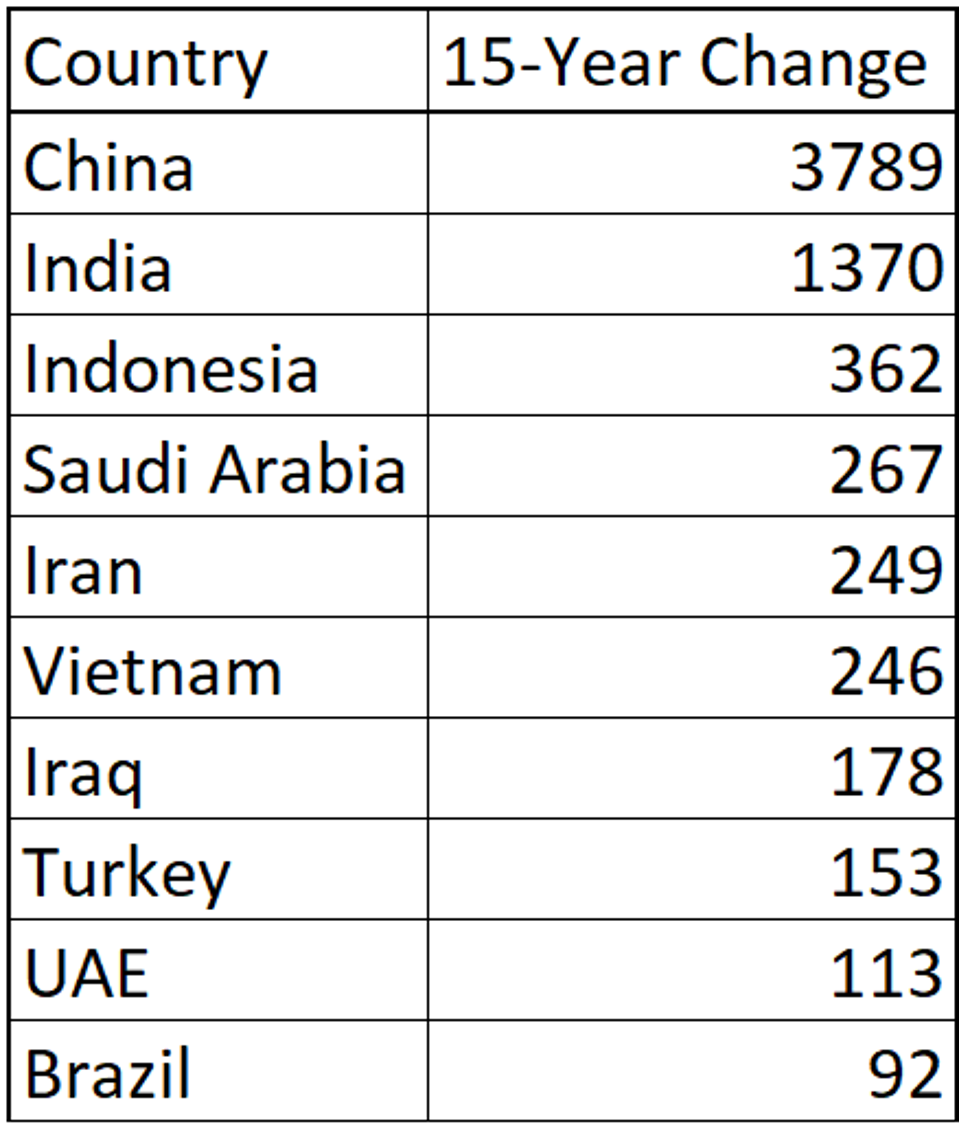
On the other end of the scale, here were the countries with the largest gains in carbon emissions over the same time period.

Note that the increase in China’s emissions was 60% higher than the sum of the decreases from the ten countries in the previous table. This is the main driver behind growing global carbon emissions.
The focus on 15 years was primarily because that’s when fracking began to substantially boost U.S. oil and gas production. In addition to seeing the largest decline in carbon emissions over the past 15 years, the U.S. also saw the largest growth in energy production. That may seem counter-intuitive, but there is a simple explanation.
Coal produces more than double the amount of carbon dioxide per unit of power production than natural gas (source). The displacement of coal by natural gas in power production enabled the huge decrease in U.S. carbon emissions.
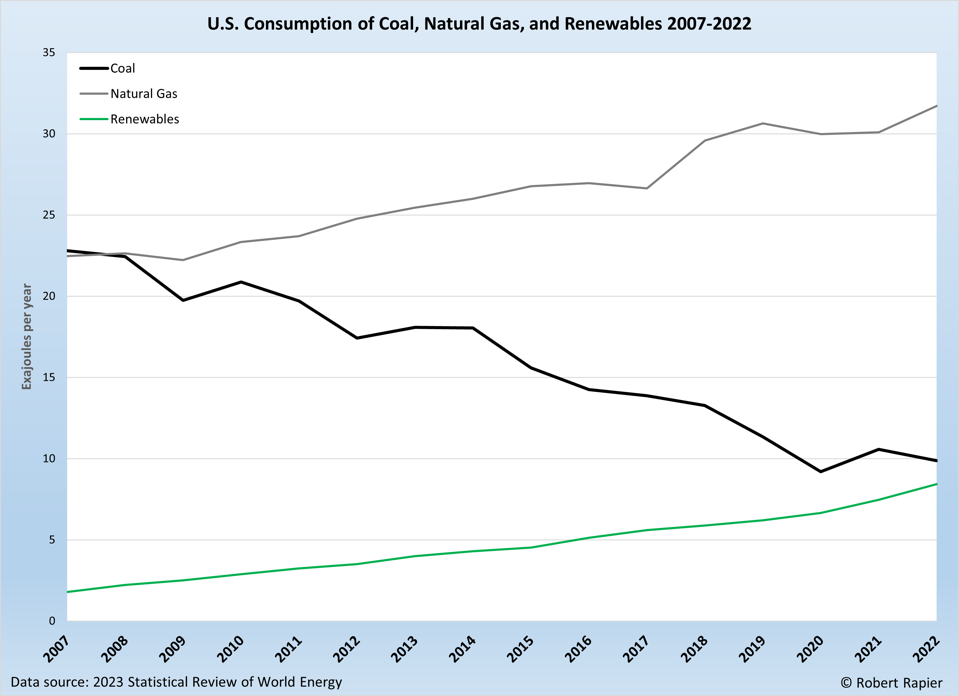
Renewables played a part, but the renewable contribution trailed that of natural gas. We can see that in the following graphic.

Coal could not have been quickly displaced by renewables alone, due to reasons of scale and reliability. This is why natural gas is often discussed as an important bridge fuel. That’s not just a theory. We can see the results in practice.
In 2007, coal had more than a 40% share of all power production, while natural gas held only a 20% share. By 2022, coal’s share had fallen to 20%, and the natural gas share had increased to 40%.
I recently saw a news story with a graphic showing the decline in U.S. coal consumption versus the increase in U.S. renewable consumption. The graphic made it seem like renewables are the reason for coal’s decline in consumption. But the graphic was misleading, because it left off the significant contribution of natural gas displacing coal in power production.
In conclusion, the data unequivocally supports the fact that the United States has achieved the most substantial reduction in carbon dioxide equivalent emissions over the past 15 years. Despite skepticism raised by some readers, the comprehensive evaluation encompasses various factors, including per capita emissions and methane leaks, confirming the accuracy of the claim.
However, it is crucial to contextualize this accomplishment, acknowledging that U.S. carbon emissions, though significantly reduced, still surpass those of many other nations. The pivotal role of natural gas in displacing coal emerges as a key driver behind this achievement, emphasizing the importance of a transitional energy source in the pursuit of sustainable practices.
Follow Robert Rapier on Twitter, LinkedIn, or Facebook


