This article contains still images from the interactive dashboards available in the original blog post. To follow the instructions in this article, please use the interactive dashboards. Furthermore, they allow you to uncover other insights as well.
Visit the blog to explore the full interactive dashboard
This interactive presentation contains the latest oil & gas production data from all 45,039 horizontal wells in the Permian (Texas & New Mexico) that started producing from 2001 onward, through July 2023.
Total Production
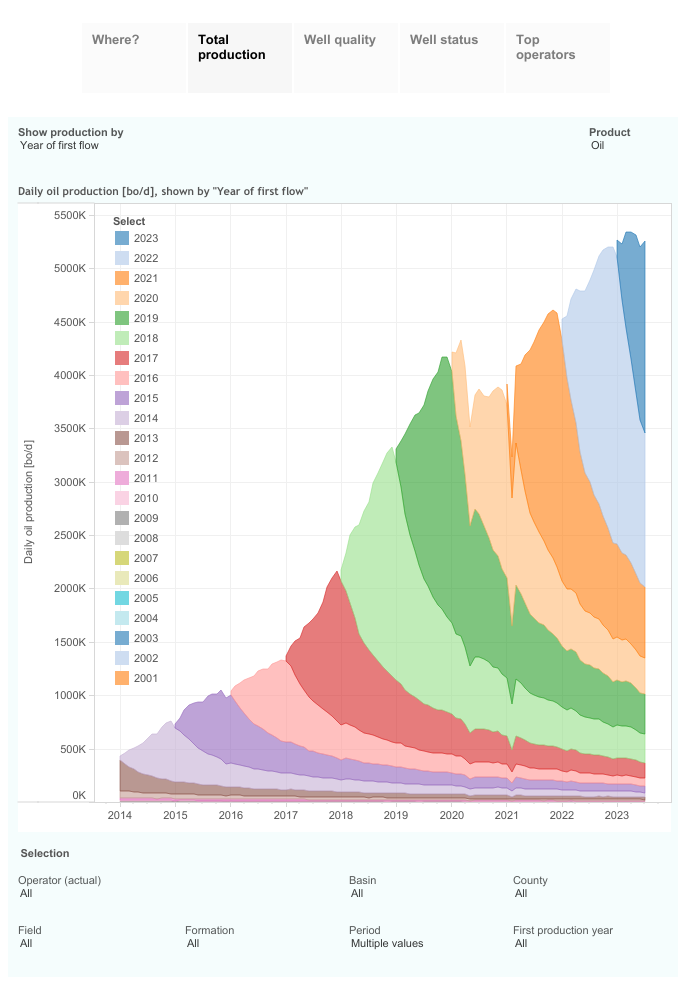
Permian tight oil production came in at 5.3 million b/d in July (after upcoming revisions, horizontal wells only), good for 60% of total US tight oil output. The reason why the chart above shows a 1-2% lower volume in July, is that as always there are a number of recently completed & producing wells that have not yet been reported by the agencies involved. Natural gas production showed a major decline to just above 20 Bcf/d in July, but preliminary data has this back up to 21 Bcf/d in August, the same level as in May.
In the first 7 months of this year, 3,232 new horizontal wells came online, vs. 3,352 in the same period a year ago, an almost 4% drop.
Drilling Activity
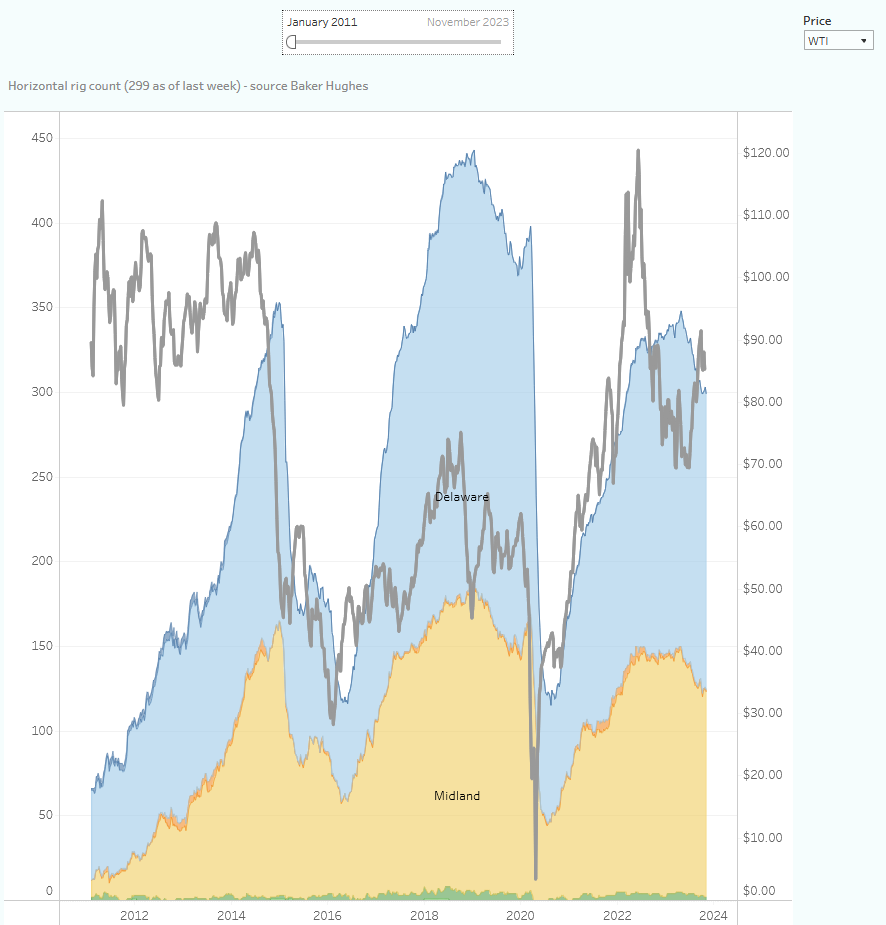
Drilling activity in the Permian Basin has fallen by just over 15% since the end of April, but has steadied since October at a level of around 300 horizontal rigs (source: Baker Hughes):
Number of rigs drilling horizontal wells in the Permian, by subbasin. Source: Baker Hughes. WTI (dark curve) is shown on the right hand axis.
Supply projection
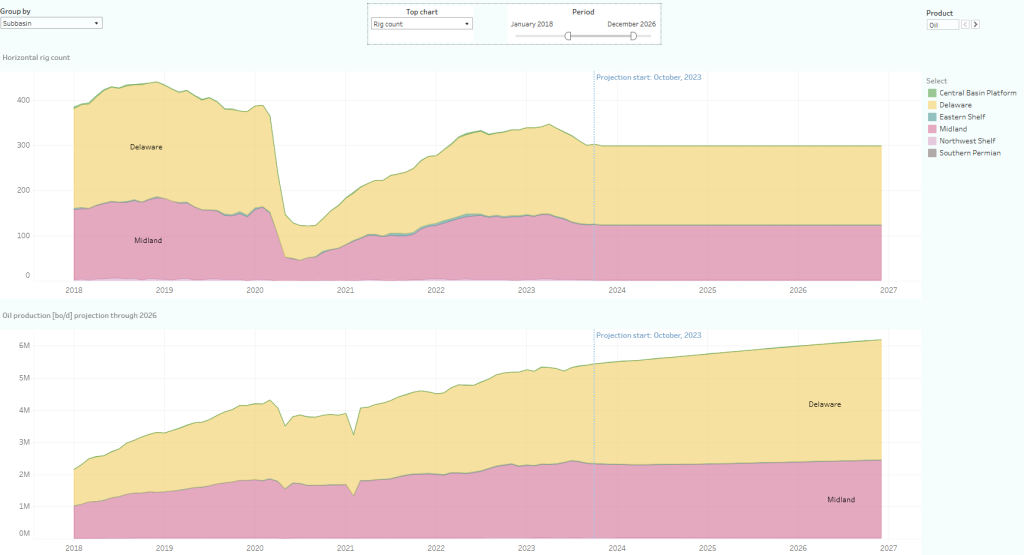
The number of active rigs as of last week (299) is sufficient to continue to grow output in the basin, if one assumes no changes in rig count and rig & well productivity (an unrealistic, but interesting base case). In such a scenario, production could grow to 6 million b/d by the start of 2026:
Supply Projection for the Permian Basin. Horizontal rig count is shown in the top chart, and historical & projected oil production in the bottom chart
Well productivity
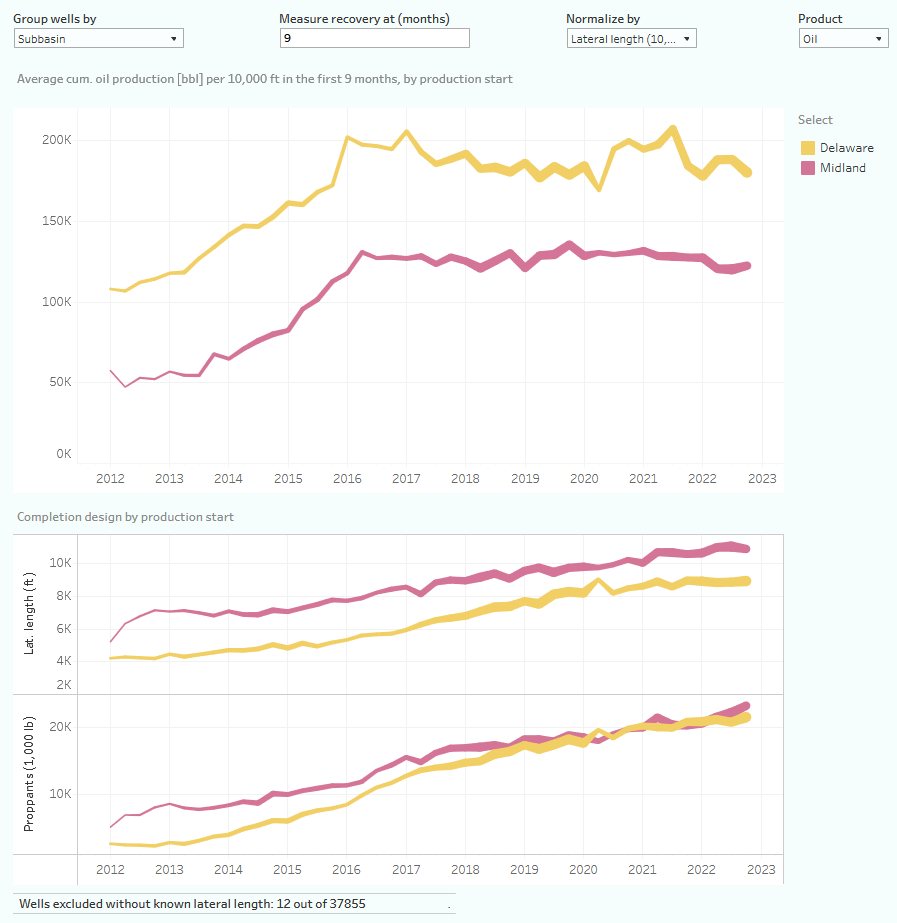
However, this does not take into account that the decline in well productivity, which we have long reported on, has not yet reversed (although the underlying Supply Projection dashboard does offer the capability to adjust for that). This decline can be viewed in the “Well quality” tab in the above interactive presentation, but also in the below overview, in which one can see the average cumulative oil production in the first 9 months, for each of the major subbasins, on a normalized basis (divided by lateral length):
Well productivity, and completion designs, in the Delaware and Midland basins. Horizontal oil wells completed since 2012 only.
The 800 horizontal wells that came online in the Delaware in the last quarter of 2022 recovered on average 180 thousand barrels of oil over the first 9 months of production, for every 10k feet of lateral length. This was 13% lower than what the 543 wells managed that began production in Q3 2021, 5 quarters earlier (207k bbl per 10k feet), although during that time with low oil prices also high-grading took place. Wells are frac’ed at every higher proppant intensities, with a ratio of 2,200 pounds of proppants for each lateral feet being the norm in recent quarters.
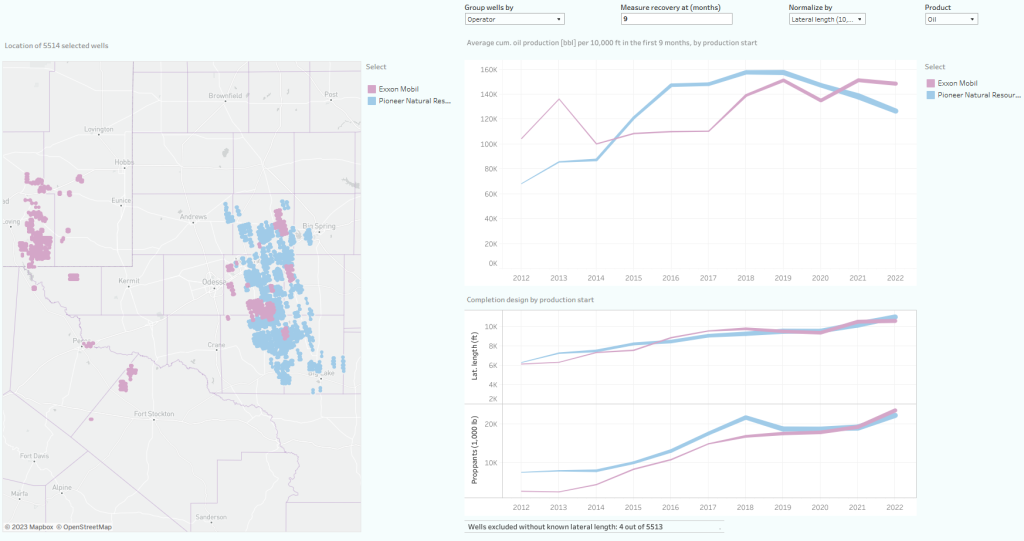
An operator that has suffered from even higher well productivity declines is Pioneer Natural Resources, the largest tight oil producer in the Permian Basin, and the target in a recent acquisition announcement by Exxon Mobil. Pioneer’s well productivity, measured by the same metric as above, has fallen by 20% during the 3 years since 2019 (see the top-right chart):
Top operators
In the final tab (“Top operators”) of the interactive presentation at the start of this post, the production and well positions are displayed for the 15 largest producers in the Permian Basin through March.
Production sharing
In an earlier post, I mentioned that Novi Labs has proprietary production agreements with operators and other parties, that have actual production data in Texas (non-allocated). Some of these licenses allow us even to republish this data to our customers. Since that post, we have continued to sign up major parties for these licenses, and by now 30% of all oil production in the Texas side of the Permian comes directly from these sources, so we do not need to allocate these over individual wells, as one would normally have to do with the data from the RRC. This is available to customers in all our services. Of course we do have various checks in place to make sure the data is of the highest quality. We expect more parties to sign up for this soon!
Finally
Production and completion data are subject to revisions.
Note that a significant portion of production in the Permian comes from vertical wells and/or wells that started production before 2008, which are excluded from these presentations.
Sources
For these presentations, I used data gathered from the following sources:
- Texas RRC. Oil production is estimated for individual wells, based on a number of sources, such as lease & pending production data, well completion & inactivity reports, regular well tests, and oil production data.
- OCD in New Mexico. Individual well production data is provided.
- FracFocus.org
Visit our blog to read the full post and use the interactive dashboards to gain more insight: https://novilabs.com/blog/permian-update-through-july-2023/


