As more utilities are leveraging data and advanced analytics in a variety of valuable use cases, the buzz around artificial intelligence and machine learning applications to improve power system operational performance is growing. As these utilities highlight the successes they are beginning to achieve, others are starting to consider how advanced analytics can also help them improve grid management and operations.
The potential to significantly improve system reliability and reduce wildfire risk makes outage prediction one of the most impactful and exciting use cases for an advanced analytics technology solution. Because there are a variety of approaches to predictive analytics solutions, it’s important for utilities to explore the differences among these solutions when deciding which one makes the most sense for their utility.
As a follow up to our PowerSession Plus, Predicting Distribution System Outages, the Next Reliability Breakthrough, I wanted to address some of the questions we received during the session.
What data type is the best for predicting outages and why?
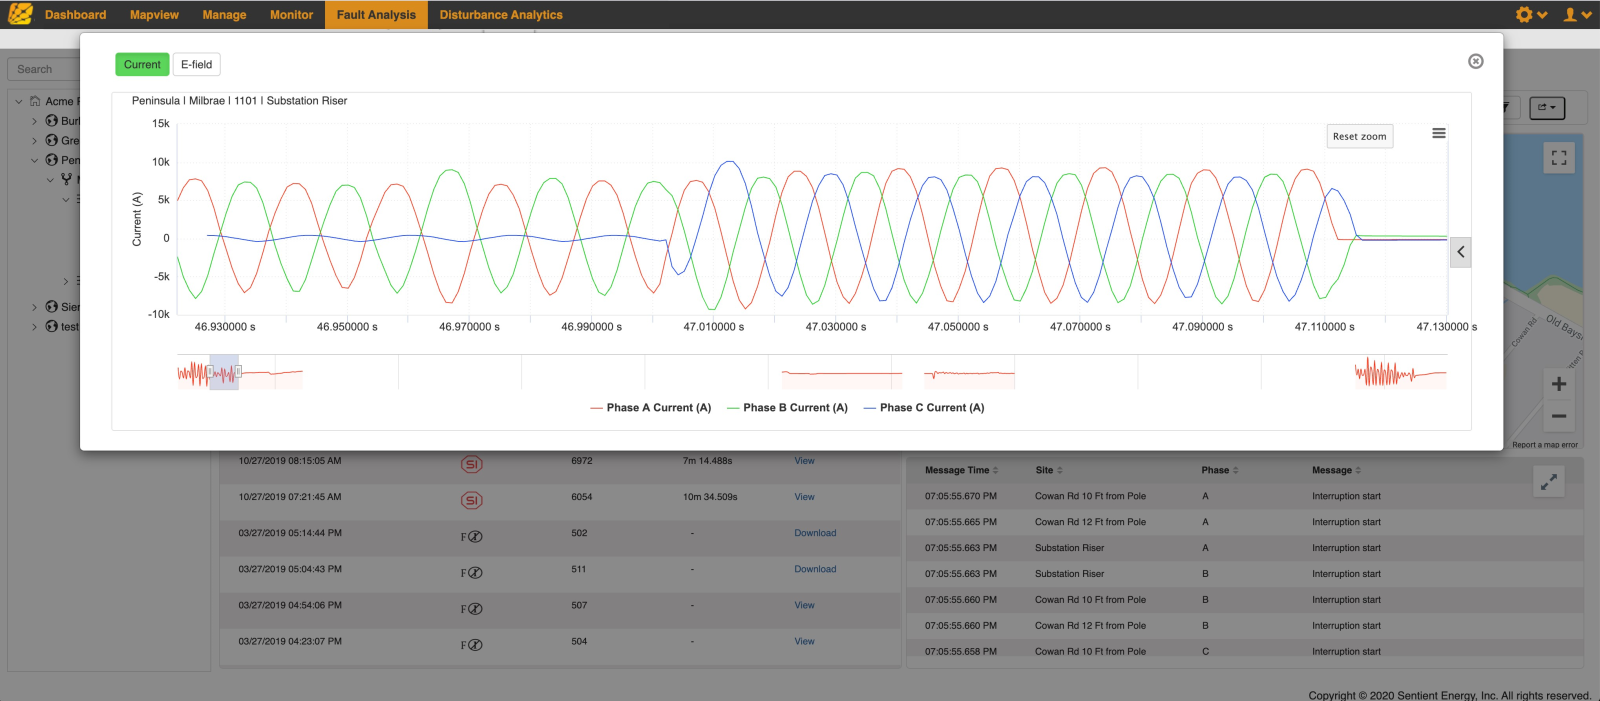
GPS-synchronized waveforms are the primary and best fidelity data source for predicting outages successfully and consistently at scale. Just as an electrocardiogram (EKG) captures electrical signals from the heart to help doctors diagnose different heart conditions and problems ahead of a catastrophic failure, geospatially dispersed edge devices that capture detailed power system oscillography data enable detection of emerging problems in the power system before a failure occurs. Certain deviations from a consistent 60Hz/50Hz power system current and voltage waveforms indicate abnormal operations, equipment degrading, objects in contact with conductors, etc.
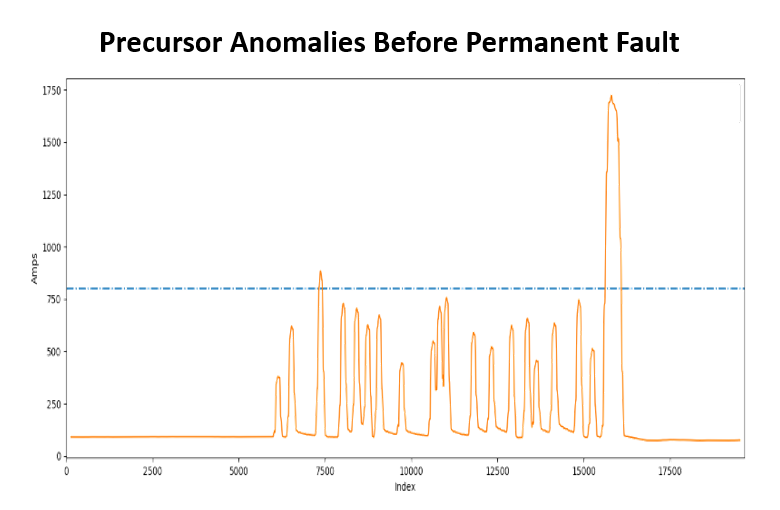
For the power system, as with a person’s health, it’s best to catch problems early. Breakthrough opportunity lies in the analysis of anomalies to detect problems before they impact operations and cause permanent faults and damage to equipment. One challenge is that oscillographic deviations also occur with normal operations of loads and grid devices such as capacitor banks, load tap changers, etc. Analytics systems must be intelligent enough to separate meaningful precursor anomalies used for prediction from normal operating anomalies that are benign in the short term.
What are the differences between using data from line sensors along a feeder versus from a single data capture device in the substation?

The first difference is about sensitivity and selectivity in capturing precursor anomalies, the key leading indicators used for predicting outages. Precursor anomalies often manifest in higher frequency disturbances, so they don’t travel far on the power system before they become attenuated and indistinguishable from the measurement noise. Moreover, capacitors and other high frequency couplings along the feeder can also completely dampen or obscure these subtle anomalies. This is the fundamental challenge with a single data capture from a substation. While it may allow prediction of problems along feeder lines close to the substation, there won’t be enough resolution and sensitivity to detect precursor anomalies further down feeders or on laterals.
The second difference is important when predictions are made. A line sensor-based solution identifies specific feeder segments to inspect, enabling shorter patrol times and higher chances of finding problems, while substation-based solutions require inspection of entire feeders.
Intelligent line sensor high resolution waveforms facilitate high probability predictions for the entire circuit. While line sensor deployment at feeder quarter points is common, it’s best to locate sensors based on the specifics of the feeder considering branches, number of customers and laterals by segment, and location of capacitor banks and switching equipment like reclosers.
Could a utility get the necessary oscillography from existing protective relays and recloser controls?
Notionally, it is possible to get oscillography from protective relays and recloser controls, but from practical point of view, the short answer is no. Oscillography from relays and recloser controls could be supplemental to predictive analysis but to achieve the required sensitivity, detection capability, and accuracy, high fidelity data capture is necessary.
The primary purpose of protective relays and recloser controls is to control breakers and reclosers when faults are detected and continued operation is not safe. They also capture oscillography records of these events to help protection engineers understand sequence of events for a fault. This type of oscillography is intended and useful for post-fault event analysis.

The oscillography needed for predicting outages is quite different and requires a dedicated trigger mechanism and data transformation workflow. Intelligent line sensors capture data at a higher rate (overhead line sensor waveforms capture 130 samples/cycle) and they sense much more subtle deviations in the power system than relays or recloser controls are programmed for. Also, line sensor sampling is GPS synchronized which is essential for aligning data from multiple sensor locations to generate accurate predictions and narrow down locations. The waveform capture resolution, sensitivity, and synchronization provided by intelligent line sensors are uniquely well-suited for predicting outages.
Is it possible to predict permanent outages from momentary faults?
Information on momentary faults is an input for Sentient Energy’s predictive analytics application but precursor anomalies are the primary data element that drives accurate predictions. Many momentary faults are one-time events like a branch in contact with an overhead conductor that burns off, so they self-clear and the system goes back to the normal operating regime.
On the other hand, precursor anomalies occur much more frequently and can persist in the system for days, weeks, or months before leading to a momentary or sustained fault. Also, in areas with high risk of wildfire ignitions, reclosing is commonly disabled or transitioned to sensitive settings so there would be no momentary operation. If the device operates, it will directly go to lockout and create a sustained interruption.
By analyzing millions of disturbance records from multiple field deployments, we have learned that precursor anomalies are the most reliable data element for high probability predictions of equipment failures and vegetation-induced permanent faults — two of the leading categories of outage causes and potential grid-induced ignitions. What’s more, these two types of precursor anomalies often start early enough to give utilities time to investigate and preempt problems before outages occur.
Is there an advantage to incorporating multiple sources of data in a predictive analytics solution?
Absolutely. Incorporating other utility data sources provides a holistic view of events and addresses more detailed questions such as outage cause and anomaly event location. These data sources include weather information (temp, humidity, wind speed and direction), feeder electrical models, feeder maps, and SCADA and OMS data. Curated data from SCADA and OMS serves as the ground truth for performance improvement of the machine learning models and helps avoid drift in high accuracy predictions.
What else should be considered when comparing and evaluating predictive analytics solutions?
As illustrated by industry stakeholder responses in Black & Veatch’s recently published 2023 Electric Report, today’s distribution grid faces multiple pressing issues. Challenges like aging infrastructure, system upgrades, and renewables integration, not to mention ongoing reliability and wildfire risk concerns, amplify the importance of each grid modernization investment a utility undertakes.
Given the number of concurrent grid challenges that must be addressed, it makes sense for utilities to seek solutions that offer multiple use cases. It’s important to assess whether other value streams exist for the predictive analytics solutions being evaluated and if so, what are they?
For example, Sentient Energy’s advanced analytics and line sensing solution can be used for other purposes that enhance the return on the investment by providing fault detection and location identification at additional points on the grid. The line sensing data enables utilities to better pinpoint fault locations and direct crews to more precise patrol areas, reducing fault finding times and outage durations, and increasing customer satisfaction.
Another beneficial value stream gained by leveraging analytics and line sensing is the use of load data for improved accuracy of network models and planning studies which are often complicated by DERs. Line sensors and advanced analytics can be used for other use cases like measuring harmonics across the fleet, automating distance to fault calculations, and DER impact analysis and fingerprinting.
At Sentient Energy we believe predicting outages with advanced analytics is the next breakthrough opportunity to significantly improve reliability and reduce wildfire risk while offering multiple additional grid management benefits. But knowing which approach to predicting outages with advanced analytics is right for your utility can be challenging. Just as no two utilities will have the same set of circumstances and needs, no two solutions will have the same technology attributes, input requirements, and benefits.
For more information on how the Sentient Energy MM3ai System can help your utility predict and preempt equipment failure and vegetation encroachment outages, please contact us.


