This article contains still images from the interactive dashboards available in the original blog post. To follow the instructions in this article, please use the interactive dashboards. Furthermore, they allow you to uncover other insights as well.
Visit the blog to explore the full interactive dashboard
This interactive presentation contains the latest gas (and a little oil) production data, from all 7,062 horizontal wells in the Haynesville that started producing from 2007, through April this year.
Total production
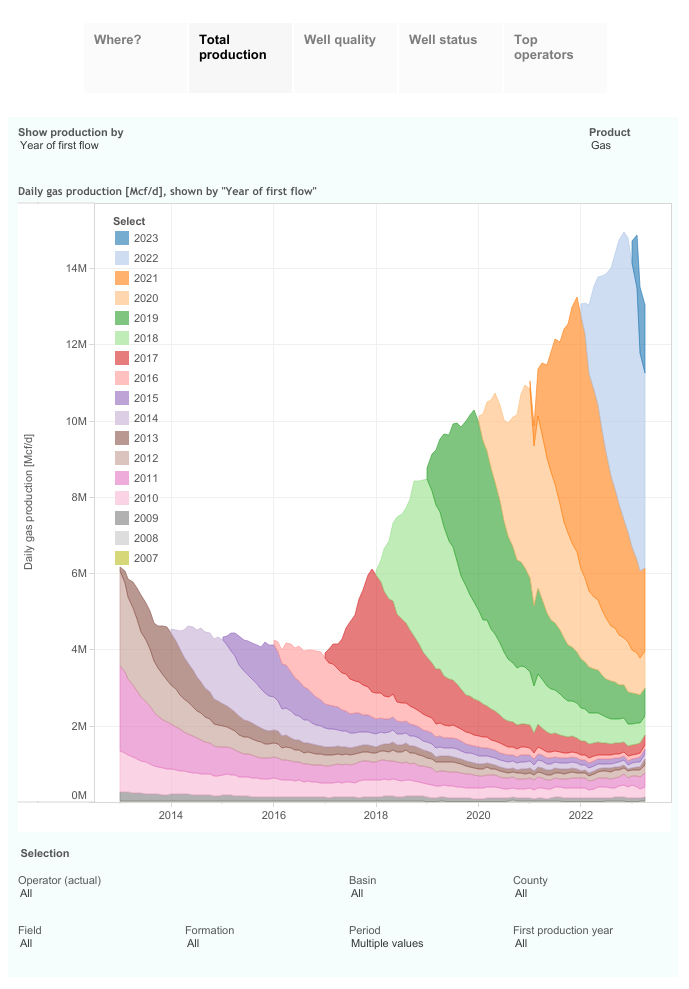
Natural gas production in the Haynesville fell to just over 13 Bcf/d in April, from 15 Bcf/d just 2 months earlier. This was the steepest drop in production in the history of the basin.
In the first 4 months of this year, 150 horizontal wells were completed, vs. 181 in the same time frame last year.
Drilling activity
This decline was of course caused by collapsing natural gas prices; where end of last year 74 rigs were drilling in the basin, when natural gas prices were above $6 per Mcf, prices have fallen by 2/3rds to just $2 per Mcf. As of last week, only 49 rigs were active in the basin (according to Baker Hughes):
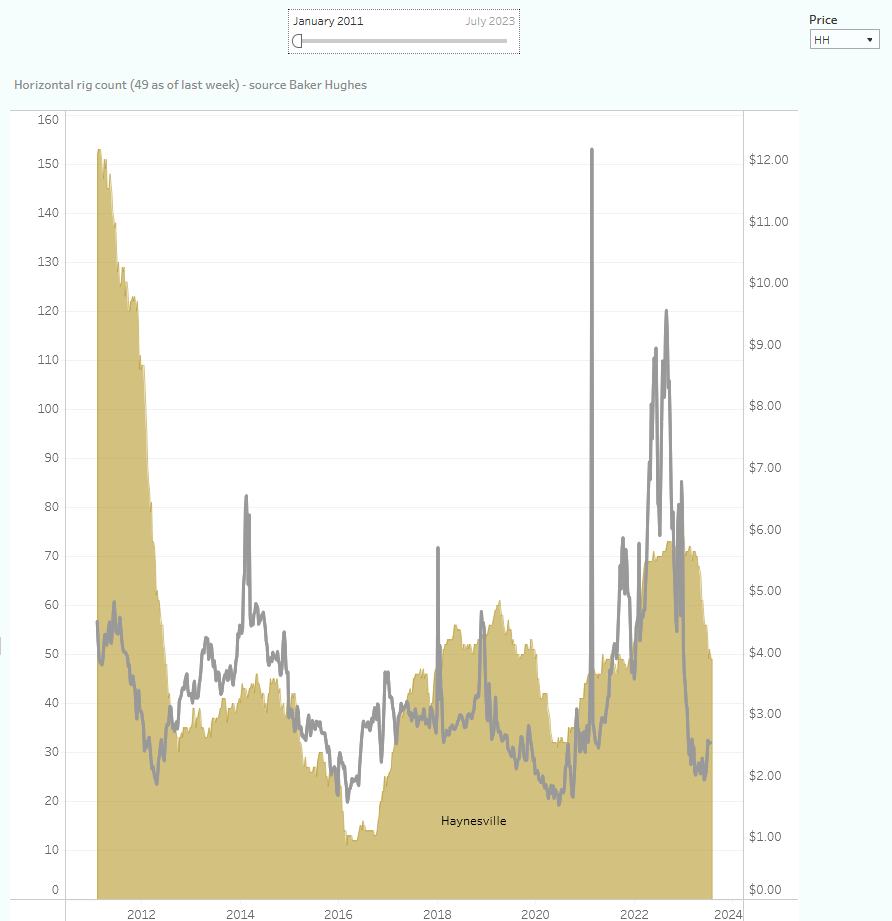
The horizontal rig count in the Haynesville (left hand side) and nat. gas prices (black curve, right hand axis)
Well productivity
Although well productivity appears to have stagnated, new wells are still producing a massive amount of natural gas, peaking at 18 MMcf/d, on average:
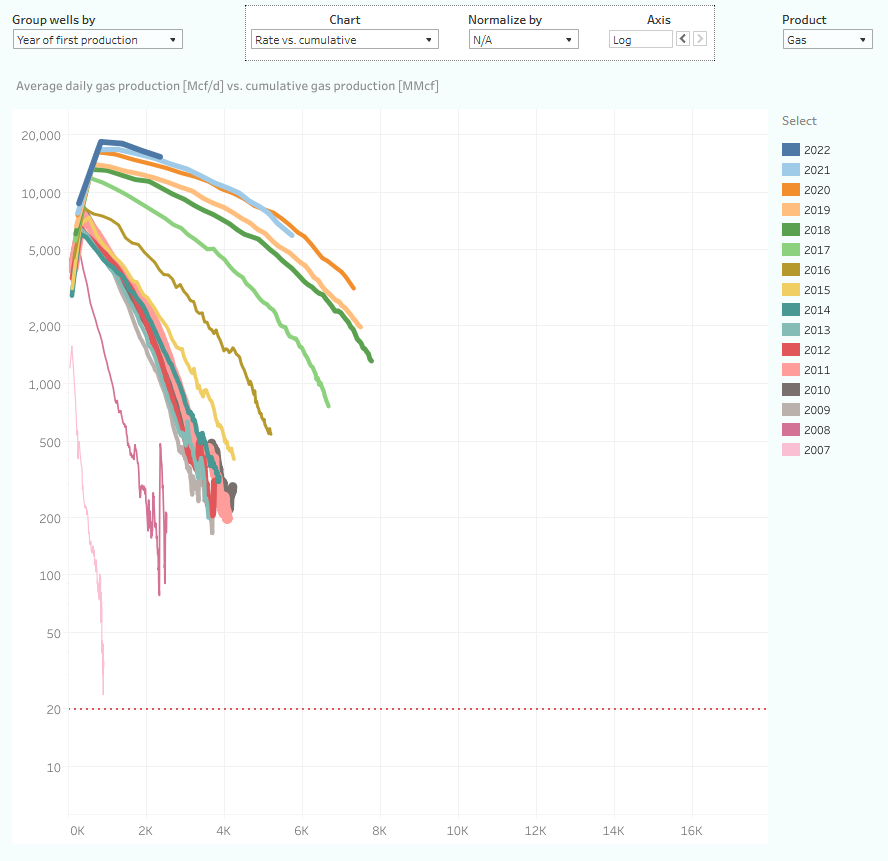
Well performance (nat. gas production rate vs. cum production) in the Haynesville, by vintage year of first production.
As can be seen in this chart, these ultra high initial production rates are followed by a steeper decline than seen in other basins, giving operators a very strong incentive to reduce drilling and completing wells in a low price environment. Wells that began production in the last few years are on track to recover between 10 and 13 Bcf of natural gas over their live time, on average.
Production by county
Natural gas production has fallen in all areas, but less so in the core of the basin, on a percentage basis:
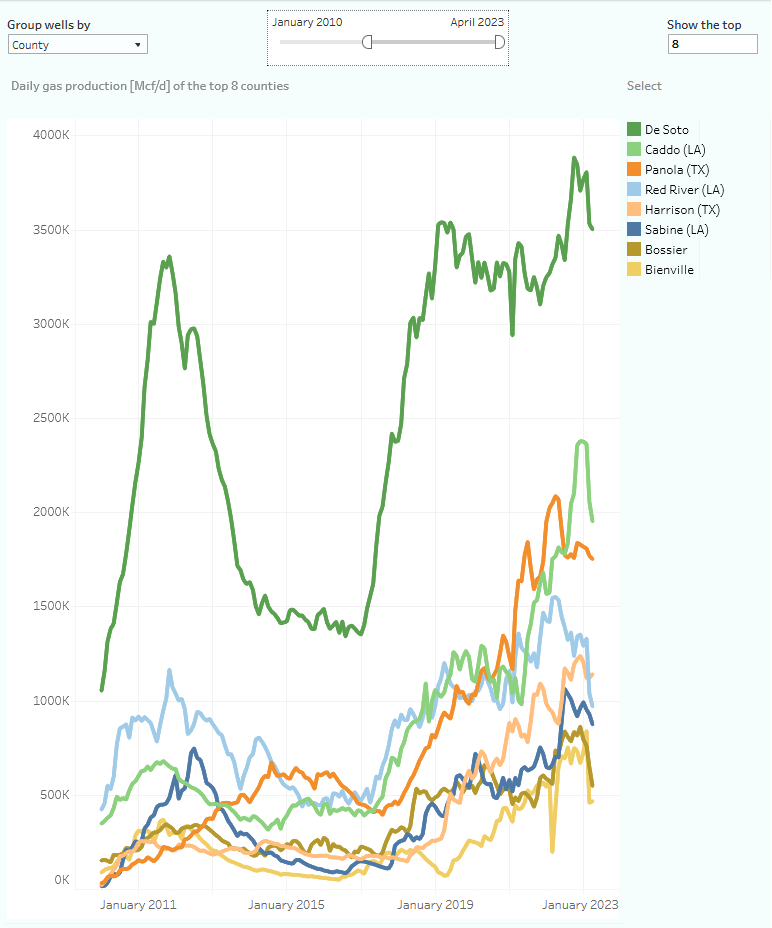
Total natural gas production in the Haynesville, by county/parish
De Soto Parish was in April, at 3.5 Bcf/d, good for more than 25% of the total volume produced in the basin, and delivers now 80% more than the next best parish, Caddo (1.95 Bcf/d).
Top operators
Basically, all major operators have drastically reduced output so far this year:
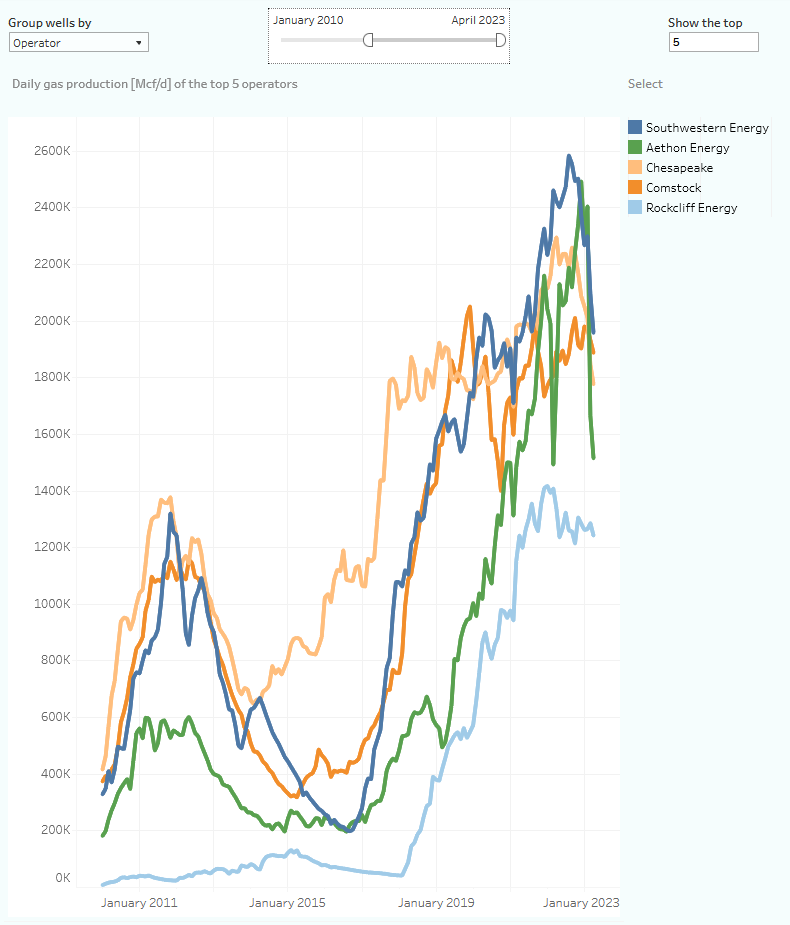
Natural gas production in the Haynesville, for the top 5 operators
Aethon Energy stands out with a fall of 1 Bcf/d in total output since December, or 40% in just 4 months.
As the following chart shows, its well results lack those of the other major operators:
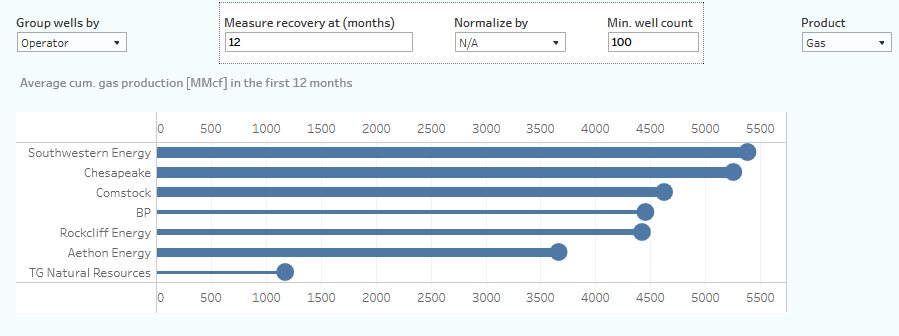
Well productivity by operator, as measured by average natural gas recovered in the first year. Horizontal wells completed from 2017 onward only.
You will find in the chart above that the 293 horizontal wells that were completed since 2017 that Aethon Energy operates have recovered 3.7 Bcf of natural gas in the first year on production, versus 5.4 Bcf/d for the 5,385 horizontal wells that Southwestern Energy currently operates.
Finally
Production data is subject to revisions.
Sources
For this presentation, I used data gathered from the following sources:
- The Louisiana Department of Natural Resources
- Texas RRC. Production data is provided on lease level. Individual well production data is estimated from a range of data sources, including regular well tests, and pending lease reports.
Visit our blog to read the full post and use the interactive dashboards to gain more insight: https://novilabs.com/blog/haynesville-update-through-april-2023-4/


