On December 1, 2022, we published our outlook for the oil and gas markets moving into 2023, which offered five major factors that we expected would drive prices through the first half of the year. Now, as we move into the second half of the year, it is time to reflect on that outlook, analyzing what we got right, what we got wrong, and why, to lay the foundation necessary to look forward through the remainder of the year and into 2024.
Russian price caps and retaliation
For the past year, we reiterated the importance of the West making the conscious decision to prioritize the fight against inflation over limiting Russian revenues to the greatest extent possible. In that time, prices have slid lower, and oil bulls have been let down, time and time again, as Russian supply to the global market has continued to surprise the upside. This was the result of a deliberate and clear policy choice. The West knew of the importance of keeping Russian oil on the market in the fight against inflation, opting for a very lenient price cap rather than the sort of sanctions placed on Iranian and Venezuelan oil exports in years past. This carried a low risk of Russia turning off spigots in retaliation, given the country’s dependency on oil revenues.
In our early December blog written before the price cap was finalized, we noted:
“While the Kremlin’s publicly communicated refusal to adhere to the cap has not inspired confidence in third country purchasers, some of whom will also look for alternative crude supplies, the G7’s proposed price cap range of $60-$70/bbl is now giving the Kremlin little to worry about. In fact, with a price cap now eyed above the market price, the price cap is ineffectual for Russian Urals crude and will only mean more paperwork for shippers to nations outside the EU.”
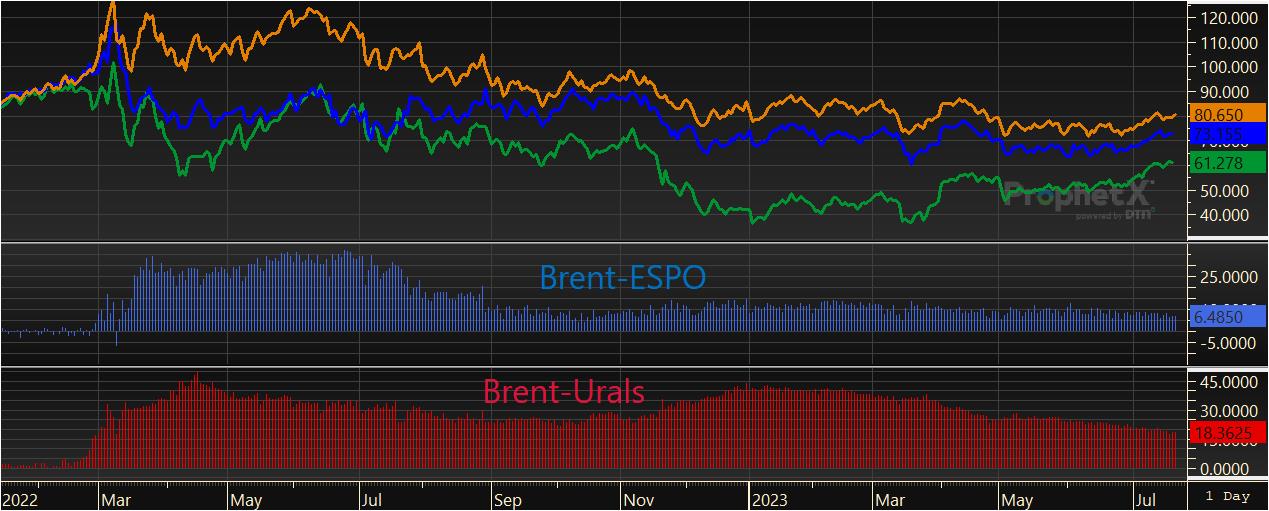
After trading below the $60/bbl price cap since implementation, Urals is now breaking above the cap.
The price cap did indeed prove to be ineffectual given that the cap was ultimately announced above the market price of Urals, but by not interrupting Russian oil flows and keeping the market well supplied; the G7 did accomplish the goal of bringing Russian revenues and inflation down simultaneously. ESPO loadings remained uninterrupted, and total Russian oil exports actually rose in the wake of the cap. Urals has traded below the $60/bbl G7 price cap since its implementation on December 1, 2022, and only recently began to test the price ceiling. While other grades, such as ESPO, have traded above that limit, short-haul waterborne exports of ESPO in Asia rely on shippers largely outside the West’s jurisdiction and reach of regress. With secondary sanctions off the table and the European Union (EU) barely enforcing its own rules, European shippers, particularly from Greece, continued to play an important role in Urals exports from the Baltic and Black Seas. A growing shadow fleet comprised of old tankers nearing decommissioning helped keep Russian exports afloat. Consequently, crude oil shunned by EU and G7 countries was redirected to India and China at steep discounts and in record amounts.
We further noted in our December blog:
“With the proposed fixed price cap now at or even above current market rates for Russian Urals, […] Europe will pay higher prices for imported fuel, and refining margins on the continent suffer. At the end of the day, EU and G7 policies regarding Russian energy commodities may do more to hurt the European refining sector than the Kremlin’s war chest, all to the benefit of U.S. and Mideast refiners who have much lower production costs and Asian refiners who continue to benefit from cheap Russian barrels.”
As expected, Europe significantly stepped up its purchases of oil products from India and the Middle East, while countries like Turkey and Saudi Arabia benefitted from deep discounts on Russian products to meet domestic demand and allow for domestically produced fuels to be shipped to Europe at a higher price. Saudi diesel imports, for instance, soared to record highs after European sanctions on the import of Russian oil products came into effect on February 5, from an average of 32,000 bpd in 2022 to close to 200,000 bpd. At the same time, the country almost doubled its diesel exports to close to 1 million bpd, with the bulk of the increase directed to Europe.
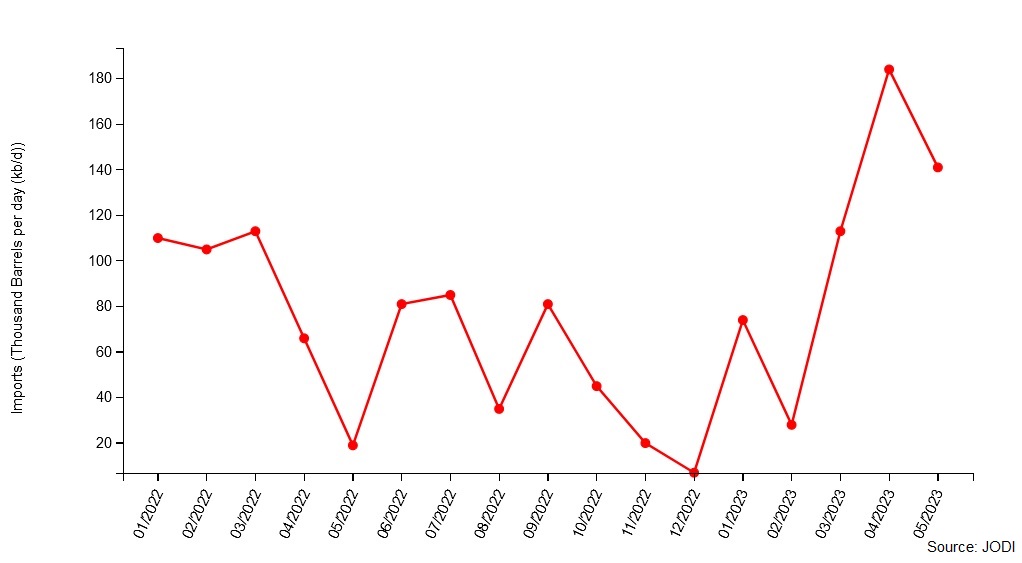
Bargain hunting: Saudi diesel imports spiked following sanctions on Russian oil products.
However, we warned that Indian and Chinese purchasing interest would be limited by refiner specifications, product yields, and in the case of China’s teapot refiners, import and export quotas. In fact, Indian purchases might already have peaked. Indian refiners are already diversifying into some of Russia’s sweeter crude grades as all the country’s refiners are not configured to run Urals as a primary feedstock, and a shrinking discount for Russian barrels is leading to fewer purchases on the spot market. Furthermore, a dim outlook for European oil product demand leaves the future of India’s product export frenzy uncertain.
We concluded in December:
“While Europe will have to pay a higher price for diesel imports from the U.S., the Middle East and Asia—a portion of which will ironically be refined from Urals crude—with European industrial and economic activity in sharp contraction, global trade slowing markedly and the European economy skidding into recession, slowing diesel demand should continue to help buffer supply side risks.”
Over the first five months of the year, announcements of production and export cuts by Russia have sent oil prices rallying repeatedly on speculation of lower supplies but those cuts were never realized. Although Russian policymakers announced that they were slashing crude production by 500,000 bpd in February, Russian exports actually rose by nearly that same amount between February and May and hit their highest export pace since the start of the pandemic this spring.
However, in a show of solidarity with a disgruntled Saudi Arabia shouldering a unilateral 1 million bpd production cut and suggesting a reassessment of production levels, very recently, Russia seems more determined to deliver on cuts to crude supply. Russian waterborne crude oil exports in June dropped 465,000 bpd from a peak 3.9 million bpd exported in May, according to vessel tracking firm Kpler. As part of OPEC+, Russia agreed to cut crude oil exports next month by 500,000 bpd from July levels. This is unlikely to translate into a 500,000 bpd production cut, however, as Russian refiners are ramping up operations after a deep maintenance season. Although we can expect these crude export cuts to continue, the same cannot be said for Russia’s oil product exports. With Russian refiners emerging from maintenance, Russian diesel exports are near record highs so far in July, and naphtha exports are rebounding.
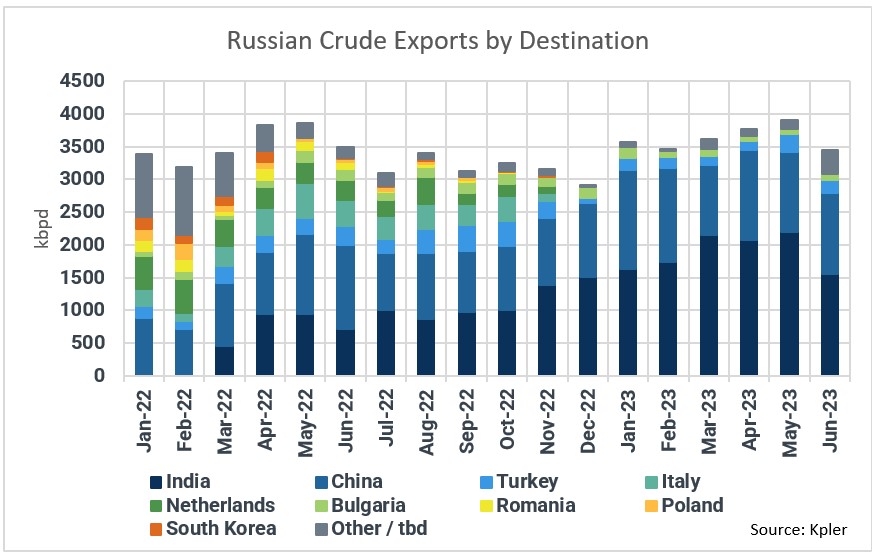
Russian waterborne crude exports rise and fall with Indian appetite.
Urals’ shrinking discount to other comparable grades has already throttled India’s appetite, and a price edging above the cap reduces the number of available tankers and introduces an additional risk premium. While waning inflationary pressures could allow the West to shift priorities, we have seen little sign from policymakers that suggest the G7 will cut the price cap in the near future. Therefore, we expect Russian exports to continue to flow at the pace Russian President Vladimir Putin and the country’s policymakers deem most advantageous depending on how events unfold in Ukraine.
OPEC trials and tribulations
Restrained OPEC supply continued to be a major theme in the first half of 2023, albeit for very different reasons than last year. While in 2022, several member states failed to meet their production targets, supply constraints over the past seven months were a result of production discipline following newly established production cuts announced in October. Although Saudi’s energy minister has been vowing to punish oil short sellers since last September, judging by the short-lived price reactions following several announcements since October, OPEC intervention in oil markets lost some of its bite over the past year.
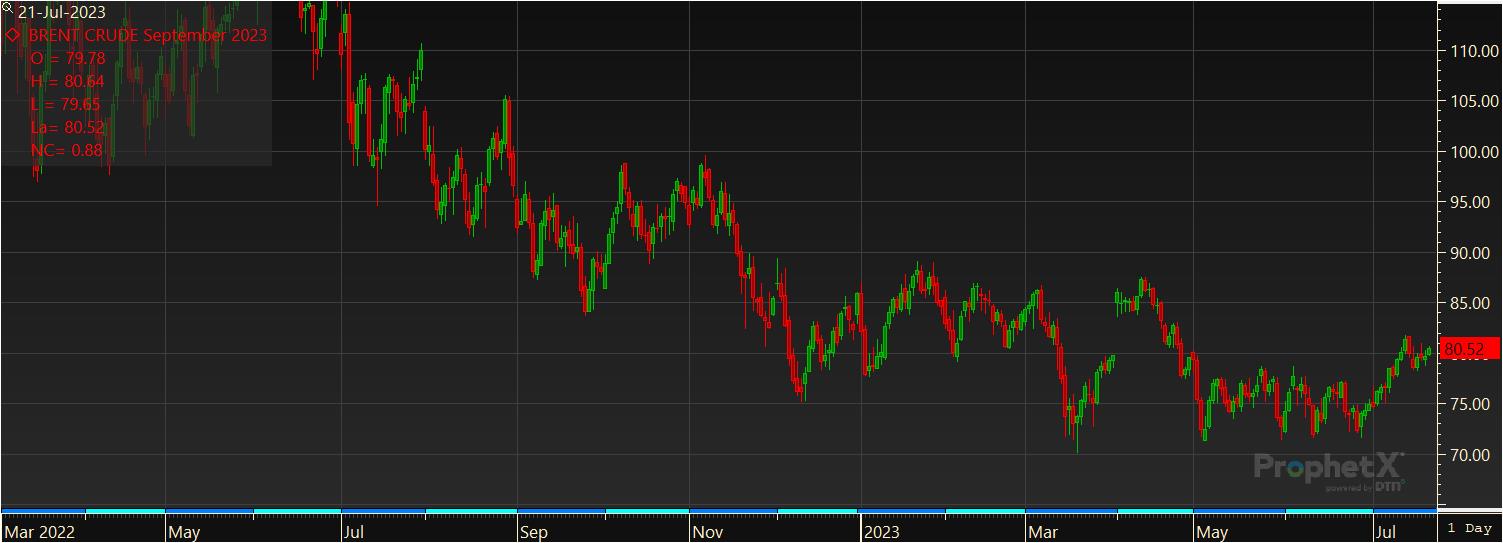
Price rallies following OPEC cut announcements were short-lived, with every subsequent announcement carrying less of a punch.
In December, we laid out why the market should temper its expectations regarding the effect of more OPEC+ cuts and why Saudi Arabia could find itself in the uncomfortable position of both losing market share to other members of OPEC+ and seeing lower prices:
“The group is staring down the prospect of a global recession at a time when Russian oil will continue to flow in substantial amounts. Signs of demand weakness have already appeared after the buying frenzy of recent months. Curbing OPEC production further to support prices may turn out to be a losing battle for the group, particularly for the Saudis, who would bear the brunt of the burden of further cuts.”
As previously discussed, Russia failed to deliver on several announced and expected cuts this year, and prices continued lower as global demand growth faced headwinds and non-OPEC+ production swelled. U.S. petroleum liquids output has hit record highs alongside U.S. exports, and new projects in Guyana and elsewhere added to global supplies. At the same time, Iranian and Venezuelan exports experienced tailwinds from a lack of sanctions enforcement. Iran not only lifted crude production by 500,000 bpd from 2022 lows but boosted exports by more than 1 million bpd by working down floating storage. According to the Energy Information Administration (EIA), non-OPEC liquids production so far this year was 1.6 million bpd higher than the 2022 average and is expected to grow by 2 million bpd this year. Consequently, global commercial crude inventories continued to build. Commercial oil and product stocks held by Organization for Economic Cooperation and Development (OECD) countries rose 63 million bbl in the first half of the year, and brimming Chinese inventories are estimated to be just shy of their 2020 record highs. All this forced Saudi Arabia back into the position of swing producer, having to shoulder additional cuts unilaterally to escape the worst of both worlds — losing market share to heavily-discounted Russian crude while oil prices continued lower. Saudi Arabia has now announced they will extend their voluntary 1 million bpd cut through August.
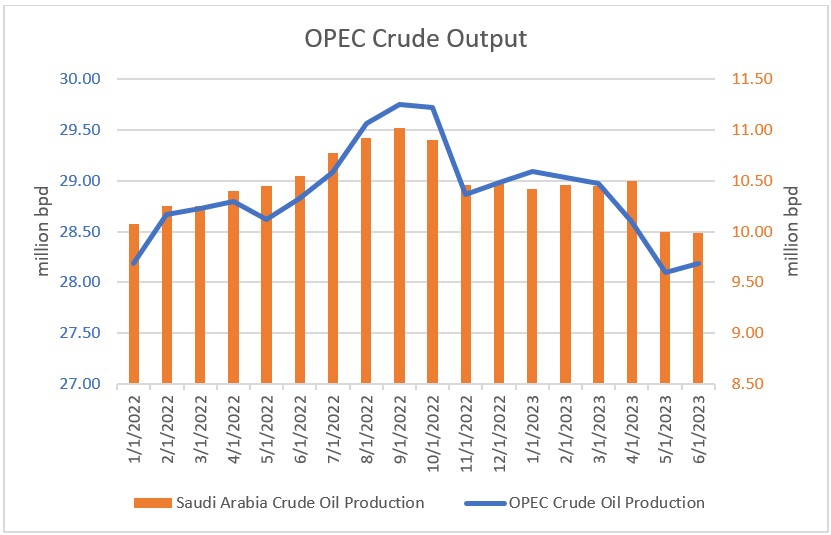
Production discipline: In May, OPEC crude oil output fell to the lowest level since January 2022.
It is noteworthy that the kingdom found itself in this predicament despite major unplanned supply outages. Wildfires in Canada have shut in substantial production, at one point taking offline more than 300,000 boe/d, and some 400,000 bpd of exports from northern Iraq via Turkey have been halted since the end of March. Additional recent unplanned outages, in combination with Saudi and Russian cuts, have started to tighten the sour crude market globally. Dubai has traded at a premium to Brent since the beginning of July, and Mars flipped to a premium to WTI in early June — now trading at the largest premium to the benchmark in two and a half years.
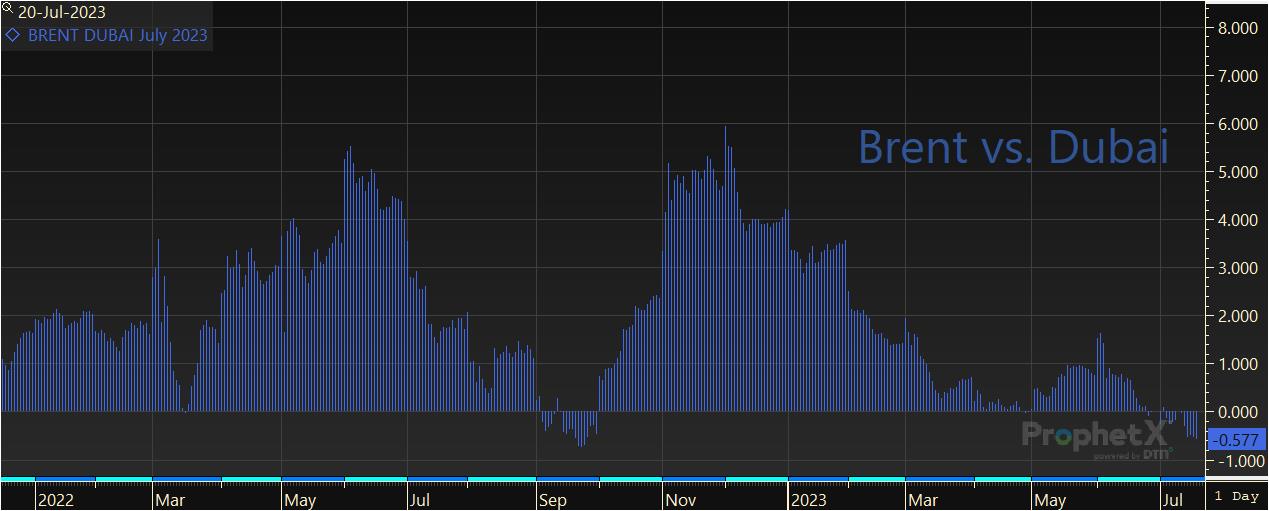
Russian and Saudi Arabian cuts combined with unplanned production outages have tightened the sour crude market.
Just a year ago, dwindling spare production capacity and lack of global supply growth was seen as a major bullish risk factor for the market. Ironically, a series of production cuts catapulted OPEC spare capacity above pre-COVID levels, from 1.67 million bpd in the third quarter of 2022 to around 4.6 million bpd, providing a comfortable cushion to supply-side risks and diminishing the risk premium which supported prices last year.
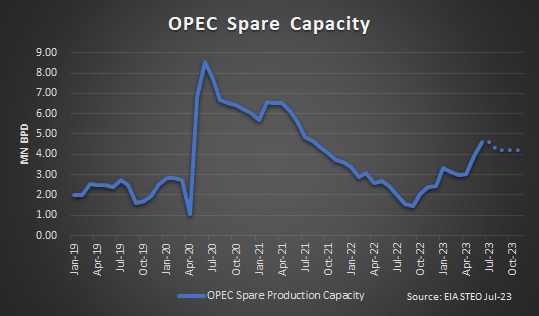
Comfy cushion: OPEC spare capacity almost tripled from a year ago.
Given diverging interests between Saudi Arabia and other OPEC members in the Middle East and the prospect of ineffectual G7 price caps, we warned of “the potential for turmoil within the group in the coming months” in our December blog, adding “other major producers in the group […] will be less than inclined to support and in practice execute deeper cuts.”
How far member countries are willing to take cuts remains to be seen. Saudi Arabia’s main priority might be protecting price, but other members like Iraq, the UAE, and Kuwait have repeatedly pushed to produce and export more oil. West African members, have in the past, ignored production ceilings and often met them out of an inability to produce more. Finally, there’s the longstanding unspoken rivalry between the UAE and Saudi Arabia, causing friction within the coalition in the past. This growing discontent among member states led to OPEC announcing a reassessment of production quotas in June. Given the new assessment will likely lead to higher quotas for Arab Gulf countries, which have and continue to invest in expanding production capacity, and lower quotas for West African countries struggling with output, the Saudis may have bought a lot of good will with this move.
We expect Saudi and Russian cuts will help materially tighten the global crude balance through the second half of 2023, continuing to pressure heavier sour crude prices higher in particular.
How long Saudi Arabia continues their voluntary cuts will be key to the global supply and demand balance going forward this year. We expect Saudi and Russian cuts will help materially tighten the global crude balance through the second half of 2023, continuing to pressure heavier sour crude prices higher in particular. However, ultimately it will be global product demand that sets the upward limit for how far OPEC+ can push these cuts through the remainder of the year.
China’s disappointing reopening
As we discussed in December, the long-hoped-for-yet-not-realized Chinese reopening had been a much-hyped potential bullish catalyst for global oil and commodity prices for over a year. While we saw a policy pivot away from zero-COVID as a potential tailwind for energy prices, given that China’s vaccine and public health preparation was still severely lacking as of late 2022, we projected that the virus would continue to weigh on economic activity and would not inspire the degree of demand recovery that many oil bulls were hoping for. Although we were surprised by the speed at which the Chinese Communist Party lifted COVID lockdowns, we were not surprised by the implications for oil prices in the first half of the year.
Indeed, by almost any measure or expectation, the Chinese reopening has been a letdown for those betting on this policy pivot, propelling Chinese equity markets, the Chinese Yuan, and oil and commodity markets more broadly. While many misconceptions underlaid the expectation that a Chinese reopening would lead to an economic boom, chief among them was an expectation that Chinese spending and consumption would surge amid years of pent-up demand. The problem is, unlike in the United States, where households experienced a financial windfall thanks to unprecedented direct fiscal stimulus and a zero-interest rate environment amid social and economic restrictions, Chinese households experienced no such financial boom amid years of lockdowns, unemployment, lost wages, and weak social safety nets. While this did benefit China, as it helped the Asian nation avoid the scourge of inflation suffered in the West, it also meant the emergence from lockdowns did not translate into surging oil and commodity prices as many in the industry had hoped.
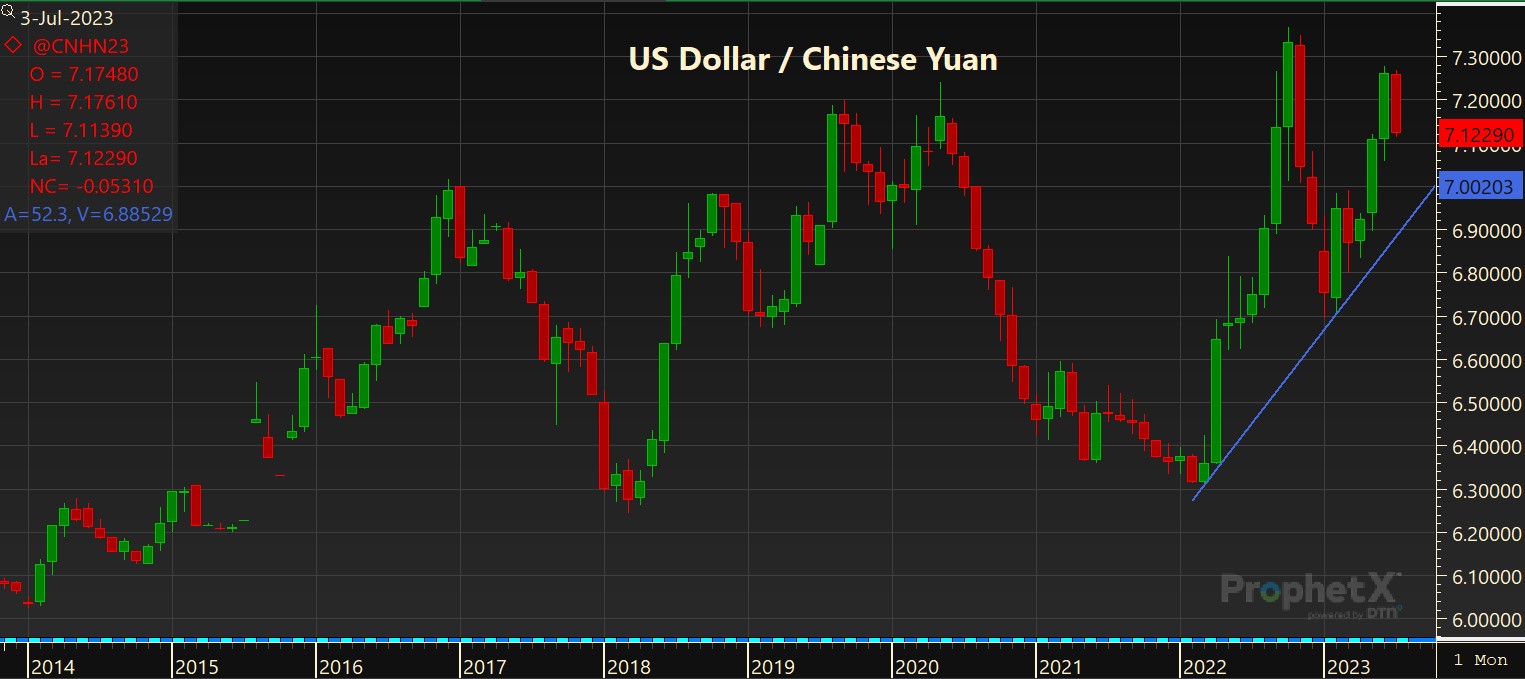
The Chinese Yuan is near multidecade lows and its weakest versus the dollar since last November.
At the end of the day, the Chinese Communist Party has had little success reorientating the Chinese economy towards greater consumption-led growth over the past decade. Household private consumption accounts for just 39% of Chinese GDP, paling in comparison to 68% of GDP in the United States. While Chinese policymakers have once again revisited this potential economic reorientation since the lifting of COVID restrictions and will likely make some policy effort to boost GDP later this year, most analysts and economists agree that this reorientation effort is a long-term goal and is not something that can be achieved in a matter of a couple months or even years.
This serves as a reminder that the Chinese economy is still extremely dependent on export markets, as exports made up their highest share of Chinese GDP since 2015 in 2022 at 20%. The lasting impact of the U.S. trade war and growing geopolitical tensions with the West surrounding strategic materials and Taiwan continue to impact demand for Chinese goods and doing business in China more broadly. When you combine this with a sharp shift in U.S. consumer behavior over the past year — prioritizing spending on services over retail goods — it is easy to see why activity in the Chinese industrial and manufacturing sectors has disappointed in the first half of the year. Demand weakness for Chinese goods in the West continues to be a headwind for Chinese economic growth and oil demand globally, as the ripple effects of less demand for waterborne container freight and airborne freight have slowed despite the reopening.
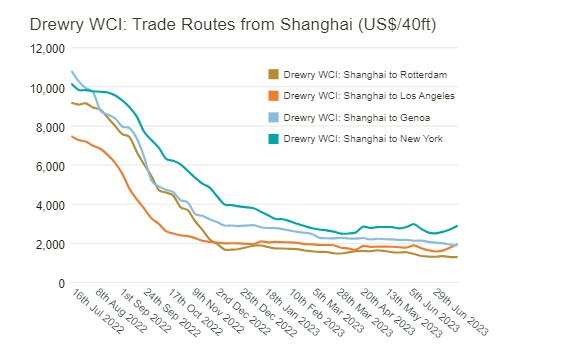
Container freight rates from China to the West continue to reflect weakness in the trade of goods.
Travel within China did surge in the spring holiday period, with domestic holiday travel during the May Day holiday reported at 20% above pre-COVID levels. This reflected the first major holiday that hadn’t coincided with a significant COVID outbreak since restrictions began to be lifted in December. However, in the weeks following this holiday travel surge, China was hit with another wave of COVID that disrupted economic activity from late May through June. Over the latest Chinese holiday period, the Dragon Boat Week Festival, travel was down 22.8% from 2019.
Demand weakness for Chinese goods in the West continues to be a headwind for Chinese economic growth and oil demand globally, as the ripple effects of less demand for waterborne container freight and airborne freight have slowed despite the reopening.
Chinese international travel is increasing, but Chinese international flight capacity is still just 51% of what it was at this time in 2019. Southeast Asian nations, some of the most frequented by Chinese travelers, have had to cut tourist revenue expectations on the back of disappointing travel data through the first half of 2023. Visitor statistics show that Chinese arrivals to their top Southeast Asian travel destinations are between 14% and 39% of pre-pandemic levels. Given that Thailand, Singapore, and other economies in the region are highly dependent on Chinese tourism, this development reflects not only weaker-than-expected activity in China but weaker-than-expected earnings and economic activity in these adjacent economies.
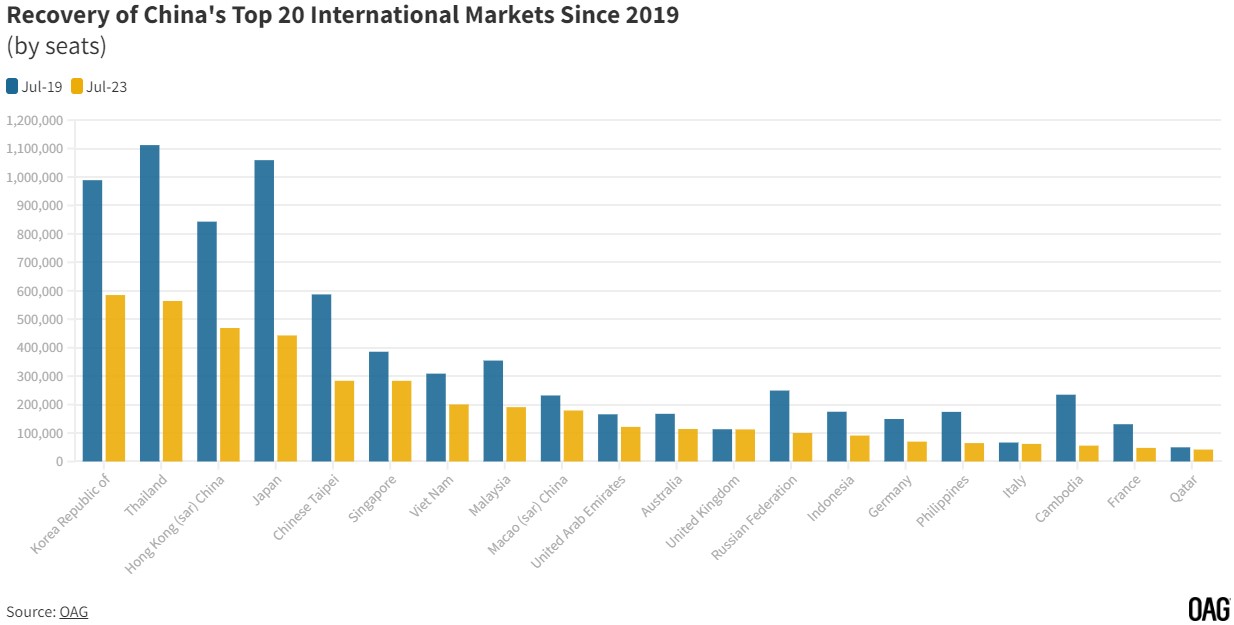
International travel from China continues to disappoint.
Although domestic economic and travel activity by Chinese citizens has disappointed this year, the pace of Chinese crude imports has continued to be misunderstood since late 2022, when they began to surge. As we described at the time, “with the prospect of continued export strength from China moving into the new year amid a backdrop of a slowing global economy, this is likely to further weigh on refining margins and crude demand in the region moving through early 2023.”
Indeed, a surging pace of crude imports in late 2022 quickly translated into surging Chinese product exports. This led refinery margins, and particularly margins for diesel, to slump sharply from November through the first quarter. Likewise, while oil demand for use in China’s rapidly growing petrochemical facilities has been on the rise, it is already leading to oversupply and crushing oil demand elsewhere. Margins for producing petrochemicals are already 40% below 2019 levels and should continue to weaken in the coming months as global economic malaise is combined with rapidly expanding Chinese petrochemical refining capacity.
Headlines are once again reporting a near-record pace of Chinese crude imports for June. This should come as little surprise given the lag time in deliveries following China going on a buying spree for Russian, Iranian, and Venezuelan crude in the spring. With these barrels often being shuffled through Malaysia before importing into China, Chinese Customs reports Malaysian imports at three times their production pace and almost no imports from these sanctioned nations. These discount buying sprees are made possible by the nation having the fastest growing storage and refining capacity of any nation globally. However, how much of that crude is refined and consumed domestically versus being pushed into inventory or exported ultimately determines how bullish or bearish that rise in imports is. If China is taking crude barrels off the market today because they view the current price as a good buy, they may simply put that crude in storage and slow the pace of imports in the coming months. If this crude is increasingly being refined but not consumed domestically, it means that product stocks are swelling, and product exports are likely to rise in the future.
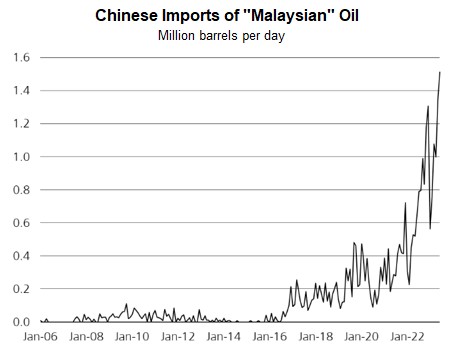
According to Chinese Customs, imports of Malaysian crude have jumped to 1.5 million bpd, three times Malaysia’s production pace, as Iranian and Venezuelan cargoes are smuggled through Malaysia.
In July, headlines are filled with reports of China’s record oil demand, but once again, we must caution against this reading of Chinese data. Because China does not release oil inventory data, reporting agencies simply calculate an implied demand figure using reported domestic production, imports, and exports. This faulty approach assumes that inventories hold steady, which is never the case in reality. Companies like Kpler and Vortexa, who track Chinese crude inventories, currently see crude stocks near the record highs that were set in 2020. At the same time, Chinese product exports are up over 40% in the first half of the year as refinery runs have pushed higher and domestic demand has disappointed.
When you consider the swelling crude inventories and strength in product exports, it is easy to see why the surge in Chinese crude imports in the first half of the year did not translate into surging oil prices. With Saudi Arabia’s intent on limiting global inventories and lifting prices, we expect Chinese crude imports to slow in the coming months. That said, with near-record volumes of crude in storage and refining margins still plenty strong, an increase in China’s refined product export quota and continued strength in product exports should not be ruled out as we move through the year. Combine this with a 5.2% urban unemployment rate, youth unemployment at a record high of over 21%, a property and infrastructure sector still reeling from years of overbuilding, an expectation of severe COVID outbreaks every six months, and little ability for the government to stimulate consumption, and you can see why China is likely to continue to disappoint those hoping for a commodity market boom. We expect these macroeconomic and oil market developments in China to help limit Russia and Saudi Arabia’s efforts to push prices significantly higher as we move through the second half of the year.
The costs and benefits of weather developments
In our December blog, we laid out a number of reasons why winter weather developments were going to be extremely important for energy markets moving into 2023. Whether bullish or bearish, with Europe more dependent than ever on LNG imports, it was clear that winter weather — particularly in Europe — was set to play a significant role in global natural gas prices — and to a lesser extent, oil. Indeed, an unprecedented mild winter across Europe led to a dramatic decline in natural gas demand and prices. This, in turn, limited gas-to-oil switching demand and helped relieve pressure across the entire energy complex.
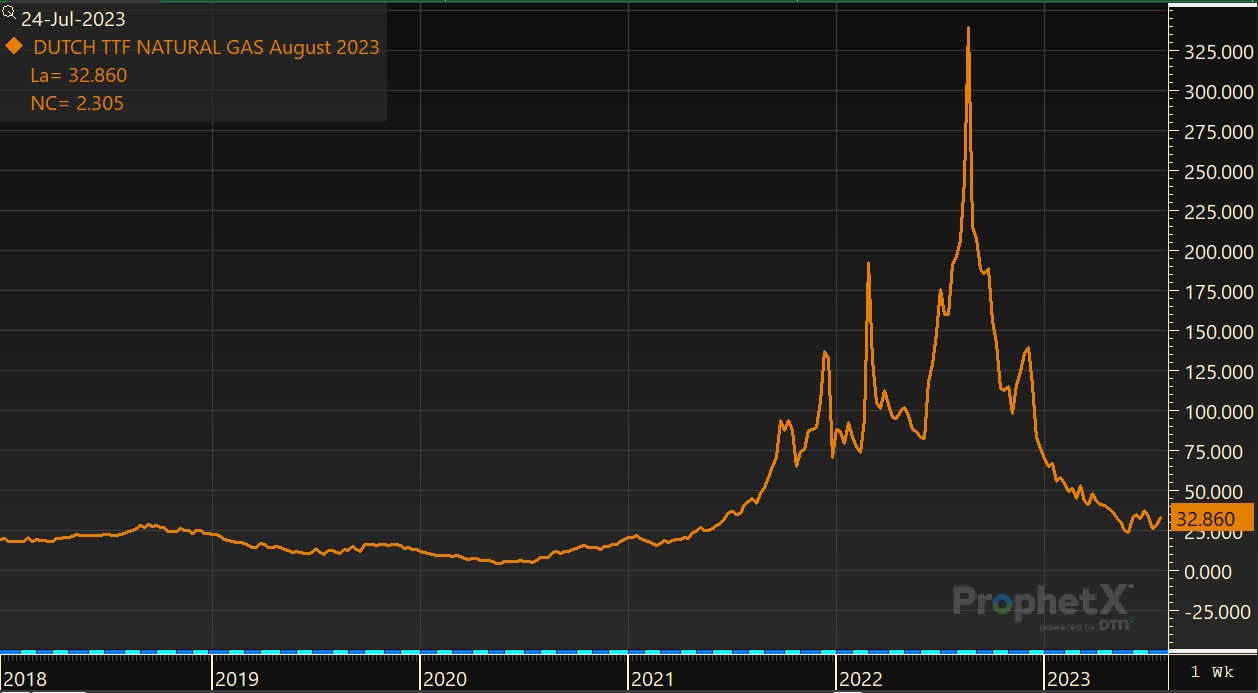
Dutch natural gas futures are trading at less than a tenth of their post-war peak but are still three times their pre-COVID norms.
As we described in December, a 10% colder-than-forecast weather scenario in the United States had the potential to leave end-of-winter natural gas inventories 40% below the five-year average. Conversely, a 10% warmer-than-forecast winter could leave inventories nearly 20% above the five-year average. This reflects the dominant role of natural gas as a winter heating fuel and the growing share of natural gas used for electricity generation both domestically in the United States and, more broadly, around the globe.
At the time of our writing in late November, the DTN long-range weather models were expecting above-normal temperatures for the southern half of Europe but below-normal temperatures for Northern Europe, creating an outlook for fairly normal natural gas and electricity demand, on average, across the continent. However, as we progressed toward winter, it became increasingly clear that the continent was set to be dealt another energy-demand-relieving season following an unseasonably warm autumn. Europe ultimately experienced its second-warmest winter on record, with temperatures averaging 1.4 degrees Celsius warmer than the 1991-2020 average. Record high temperatures for the season were recorded from late December through early January, from France to Hungary and as far north as Denmark. For context, temperatures on New Year’s Day in Spain were on par with their historical averages for the month of July.
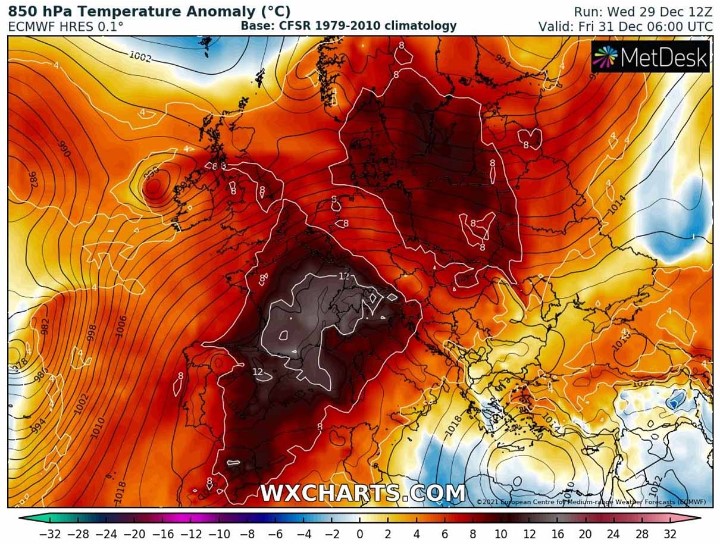
Extremely mild winter temperatures in Europe limited natural gas demand around the continent.
This extreme warmth has persisted and continues to impact Europe this summer. However, unlike in the United States, where nearly 90% of homes have air conditioning (AC), only around 10% of European homes have AC, with roughly 5% of homes in France and 3% of homes in Germany equipped with AC. This means that unlike in the United States, where electricity and natural gas demand surges in the peak heat of the summer as it does in the peak of the winter cold, hot European summers result in a much smaller impact on natural gas and electricity demand. Some Southern European nations, like Italy and Spain, have higher AC penetration in households, but this figure still stands at less than 20% of residences. While this small percentage of AC utilization is still enough to materially impact electricity demand in these countries amid extreme summer heat as we’re seeing today, higher AC utilization rates in southern Europe are still not enough to cause the same seasonal impact on the electricity demand curve in the EU as is seen across the Atlantic in the United States.
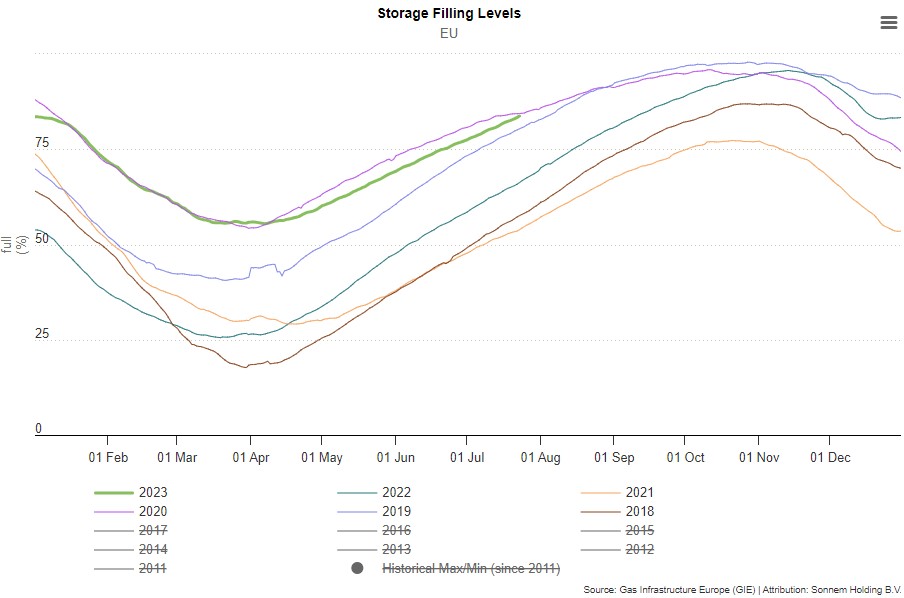
A warm winter, strong LNG imports, and weak industrial demand have put EU natural gas storage on pace to reach capacity well ahead of expectations.
As such, European natural gas levels were not only not depleted in the winter but are able to continue to build this summer despite the lack of pipeline deliveries from Russia and high temperatures. Currently, EU natural gas inventories are nearly 82% full — well ahead of their normal seasonal refill pace. United Kingdom (UK) inventories are in worse shape at 58% of capacity but are still holding up relatively well for the seasonal period. That said, the extreme heat in Europe this summer can mean marginal increases in fossil fuel-powered electricity generation if low water levels and high-water temperatures in Europe lead to limitations on nuclear power generation. Already this year, both France and Hungary have had to curb nuclear power electricity generation amid unseasonably warm river temperatures. The European buildout of solar power generation serves as a bit of a counterbalance, alleviating the demand-pull on natural gas for power generation in periods of peak summer heat.
Extreme heat along the U.S. Gulf Coast this summer has impacted oil and gas operations and stretched electricity grids to their limits. Record temperatures in Texas in late June shut in nearly 200,000 bpd of refining capacity in the lead-up to the July 4 holiday, helping boost gasoline prices and limit inventories. Heat-related refinery issues have now tormented the industry for nearly the entirety of July. This follows unseasonably warm and dry conditions in Alberta, shutting in over 250,000 bpd of crude production and nearly 3 Bcf/d of natural gas production in May. Wildfires continue to plague Canadian oil and natural gas producers, and Canadian officials fear that the fires may not be quelched until winter snow arrives.
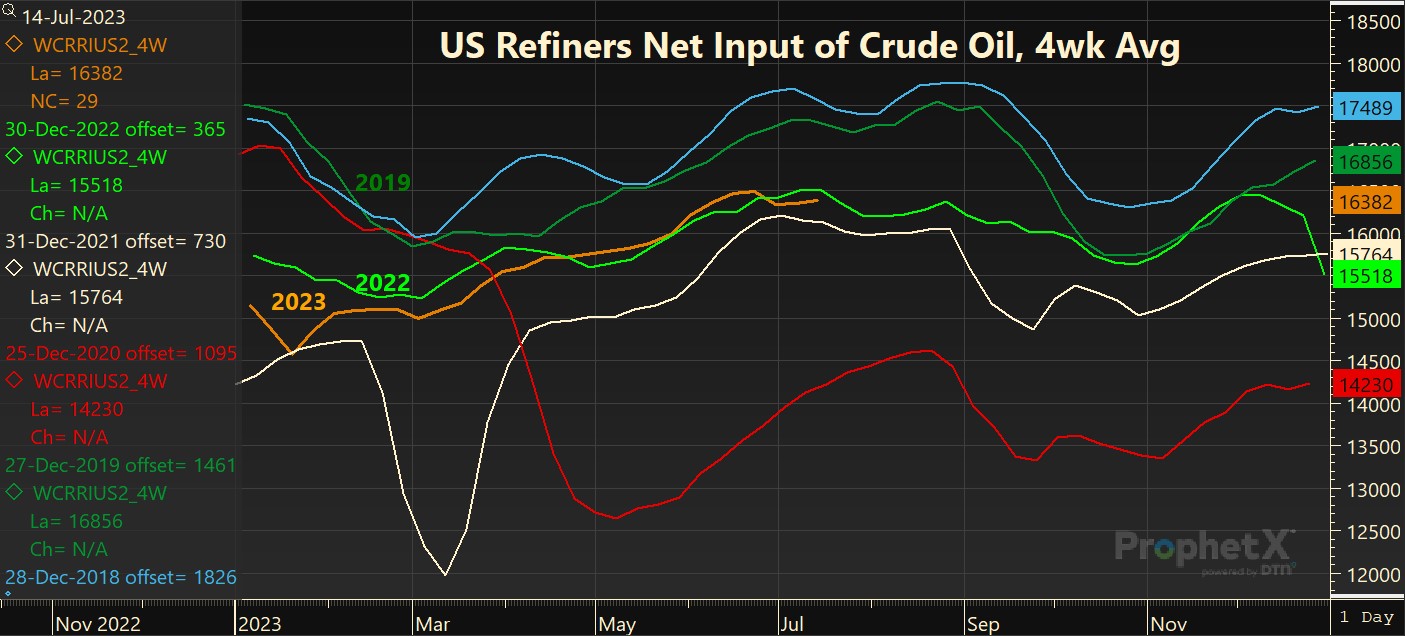
A deep and lengthy spring refinery maintenance season has been followed by unplanned outages.
In the near term, the most pressing weather risk for oil and gas markets comes by way of the Atlantic hurricane season, which runs from June 1 through the end of November. The DTN meteorology team is predicting 17 named storms, seven hurricanes, and three major hurricanes (Category 3 or higher) during the season. Although Atlantic sea-surface temperatures have been well above normal, high levels of wind shear have limited the risk of hurricane development so far this summer. Our forecast for wind shear easing as we work into August, combined with extremely warm water temperatures, raises the risk of a hurricane making landfall along the Gulf Coast in the coming month. That said, if current forecasts hold, an El Niño-inspired return of elevated wind shear should limit hurricane risks to Gulf Coast oil and gas infrastructure during the majority of peak hurricane season, from late August through October. However, given the remarkably warm water temperatures, the risk of even a single, extremely strong storm making landfall should not be overlooked.
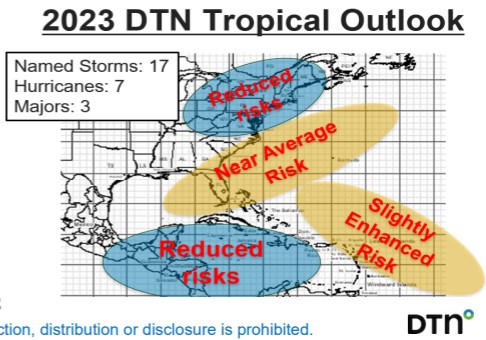
El Niño’s hurricane-diminishing influence is likely to be counterbalanced by warmer-than-normal sea surface temperatures.
Temperatures across most of Europe are expected to normalize in August, helping alleviate the recent impacts of extreme heat in the region. However, above-normal temperatures are expected to return in September. With an expectation of this warmth extending into November in our current forecasts, this would mean below-normal natural gas and electricity demand heading into winter once again this autumn. Expected above-normal wind speeds across Northern Europe this fall should also help limit natural gas demand amid strength in wind generation.
Mother nature threw oil and gas bears a massive bone through the second half of 2022 and winter 2023. With U.S. natural gas production making new record highs this year, natural gas stocks currently brimming in the United States, and European stocks robust, the current weather forecast suggests far lower bullish natural gas price and energy security risks moving into this winter when compared to last.
The impact of a weakening economy on energy prices
When writing in late November, we highlighted how governments prioritizing quashing inflation would trump economic growth aspirations in the coming months, leading to a weakening global economy in 2023. The EU did slide into recession in the first quarter, and while the course of the Federal Reserve’s interest rate path was higher for longer as we expected, the United States did not move into recession despite leading indicators and a wide array of historic statistical relationships pointing that direction in late 2022. However, as we said at the time, for the sake of oil demand outlooks, the devil is in the details.
Ultimately, it was our outlook for weakening activity in the freight, manufacturing, and industrial sectors — heavy users of diesel and other middle distillates — that led us to conclude that distillate fuel oil demand had already peaked in the early autumn. While U.S. distillate fuel oil demand typically peaks in the depths of winter in the first quarter, amid the influence of the heating oil demand season, the pronounced weakness in distillate demand elsewhere in the economy caused distillate fuel oil demand to weaken through the fourth quarter and prevented the normal seasonal strength seen in the first quarter of this year.
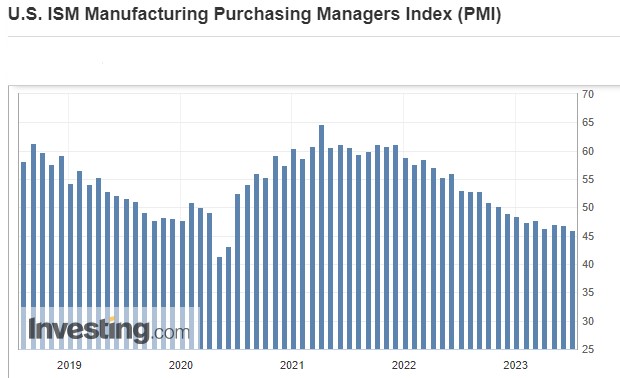
U.S. ISM Manufacturing continues to disappoint and show contraction in the sector.
The U.S. ISM Manufacturing PMI moved from slight expansion with a reading just above 50 in October to contraction throughout the remainder of the fourth quarter. The manufacturing activity indicator sank to just 46.3 in March, down sharply from the 57.1 reading for the same month in 2022. EIA monthly product supplied data shows first-quarter distillate fuel oil product supplied averaging 3.2% below 2022 levels for the period and 6.2% below 2019 levels for the quarter. Despite U.S. exports of distillate fuel oil at seasonal record highs moving into 2023, domestic demand weakness led to consistent counter-seasonal builds in distillate fuel oil stocks in January and February and sent inventories 16 million bbl above their November lows by early March.
Gasoline demand, as measured by the EIA’s monthly product supplied figures, averaged 2.5% below fourth-quarter 2021 levels in the fourth quarter of 2022, sending U.S. gasoline stocks 16.9 million bbl higher over the final two months of the year. Even with U.S. refinery runs suffering a severe setback in late December and January amid extreme cold temperatures that shut in refining capacity, with gasoline demand averaging 4.5% below 2019 levels in the fourth quarter and nearly 4% below pre-COVID levels in the first quarter this year, gasoline inventories continued to swell by over 15 million bbl by mid-February from the start of the year, as we had expected in December.
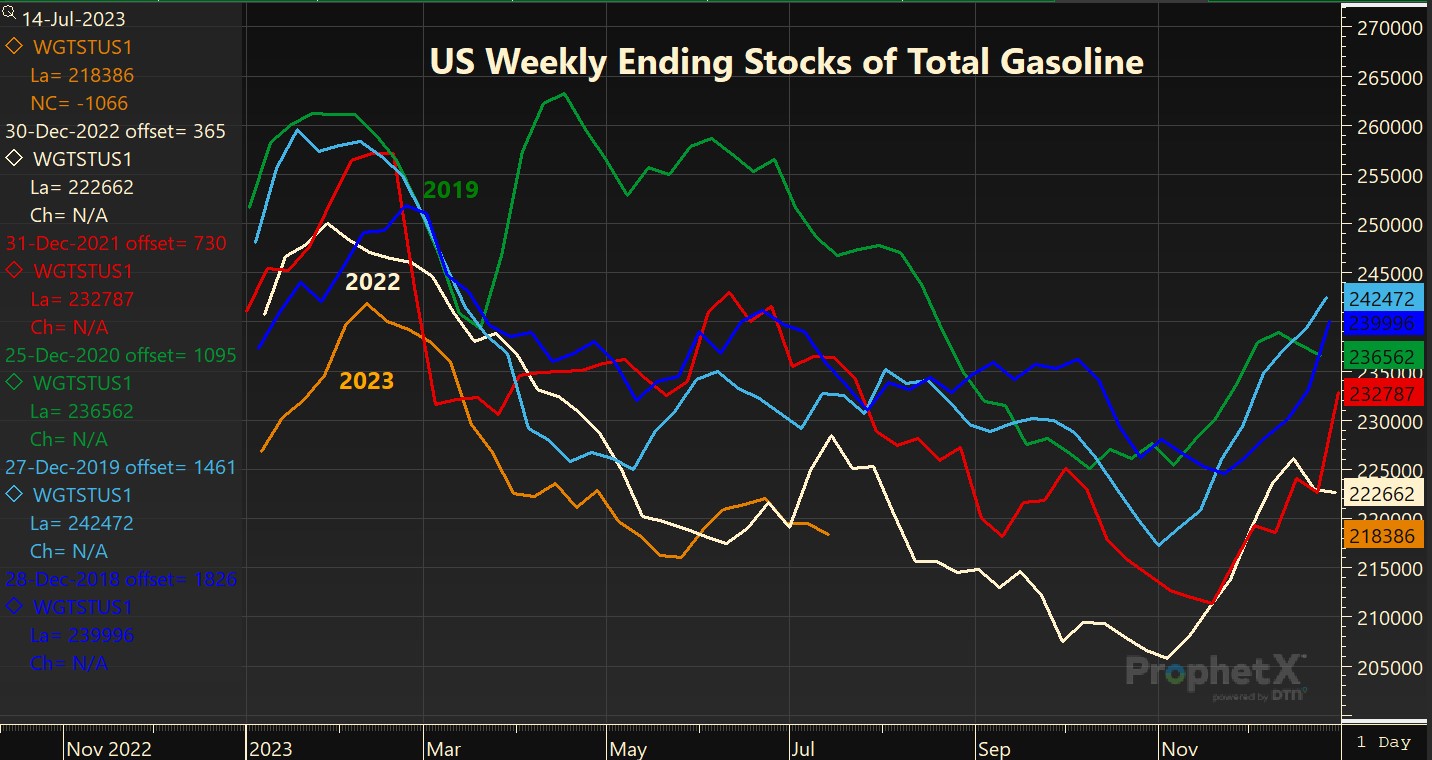
U.S. gasoline stocks are now well below year-ago levels and recent historical norms for the season.
Disappointing economic activity in early 2023 and an expectation for central banks to continue to tighten monetary policy led the International Monetary Fund to issue its weakest global growth expectations in more than three decades this spring, expecting global GDP growth of just 2.8% this year and 3% in 2024, compared to 3.4% in 2022. While the United States continued to report positive GDP growth of 1.8% in the first quarter, and the Atlanta Fed’s GDPNow estimate for the second quarter stands at 2.4%, inflation-adjusted incomes are still well below where they would have been if they had continued their pre-COVID growth trend.
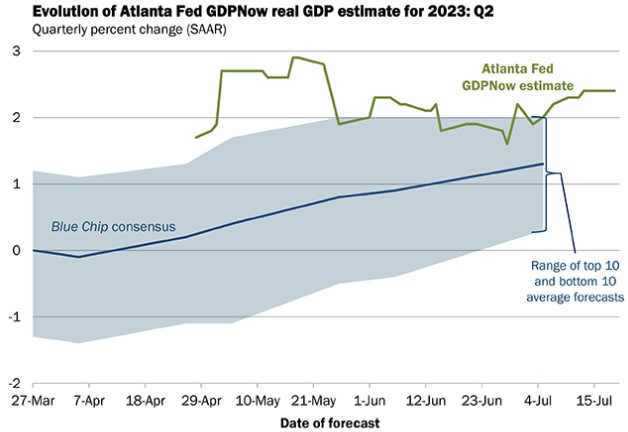
The Atlanta Fed’s GDPNow estimate currently expects positive Q/Q growth.
Gasoline demand, which had suffered amid record-high prices in 2022, began to outpace year-ago levels as we worked through the spring as inflation pressures eased, gasoline prices plummeted, and inflation-adjusted incomes rose. By April, gasoline supplied in the United States averaged 242,000 bpd above the 2022 level for the month. That said, with labor force participation still suffering amid mass retirements and long-COVID inspired debilitation, work-from-home proving sticky, and inflation still lingering, this still left gasoline demand 415,000 bpd or 4.4% below 2019 levels for the period.
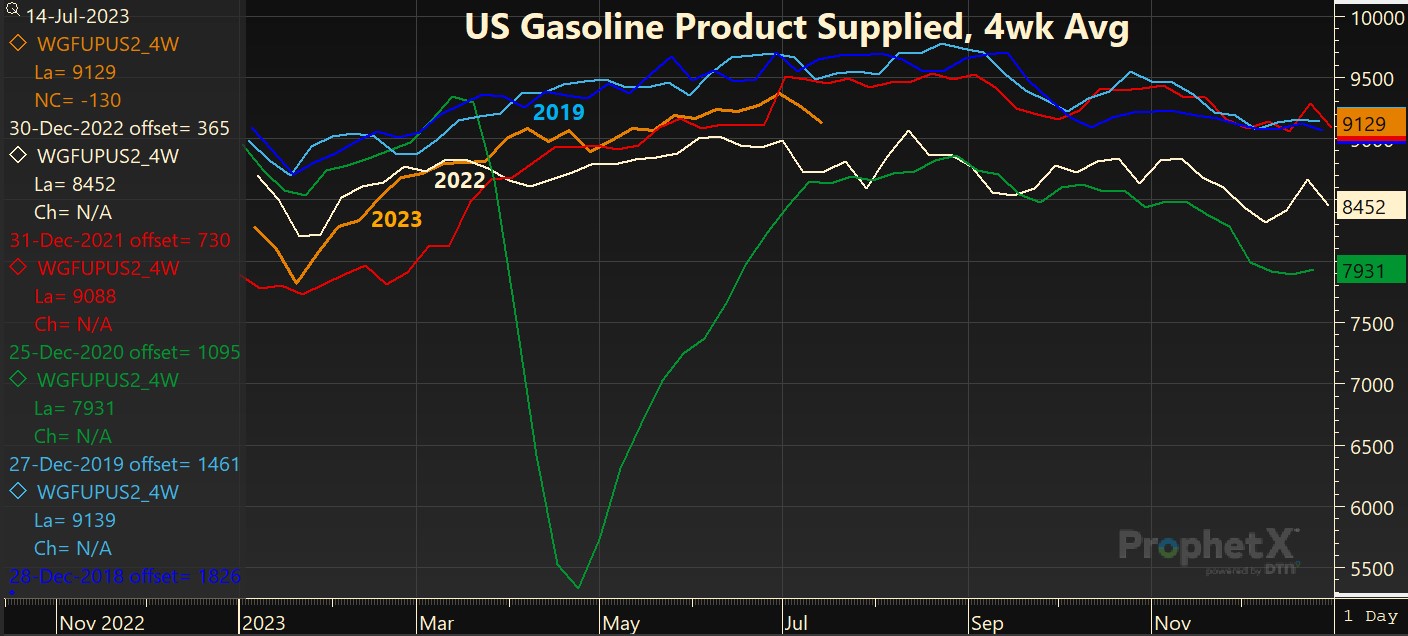
Gasoline demand in the United States continues to hold below pre-COVID levels despite lower prices this summer.
While economic developments like these are certainly important for the pace of oil demand, unforeseen disruptions to supply can easily offset their impact. Refinery strikes in France, unplanned refinery outages in both the United States and Europe, and a deep and lengthy refinery maintenance season in the United States this spring halted the sharp pace of builds we saw earlier in the year and began to lead to draws to inventories once more despite fuel demand continuing to disappoint. Currently, gasoline demand is averaging 4% below 2019 levels for the seasonal period, and distillate fuel oil demand is averaging 8% below pre-COVID levels as both on-road and rail freight activity suffers. However, refineries along the Gulf Coast are facing unplanned outages once more amid extreme temperatures in the region, taking capacity offline, limiting product inventory builds, and pushing fuel prices higher. With gasoline inventories now lower than distillate fuel oil inventories when compared to historic averages and diesel demand much weaker than gasoline on a relative basis, gasoline crack spreads are $3.25/bbl above diesel cracks.
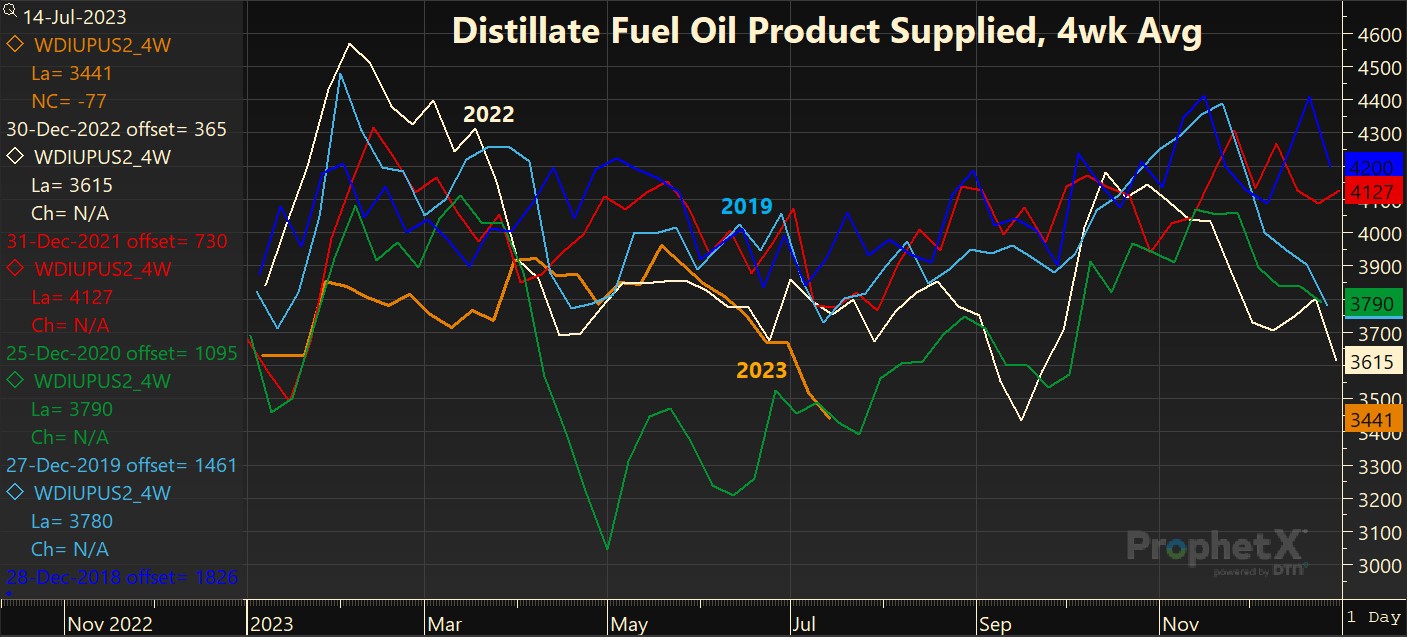
Distillate fuel oil demand continues to disappoint and is sinking this summer as industrial and freight activity contracts.
U.S. industrial production fell for a second consecutive month in the latest data for June, which continues to help explain why distillate fuel oil demand continues to suffer worse than gasoline demand. At the same time, weak industrial activity is helping U.S. natural gas inventories swell amid a record pace of domestic production. Likewise, in Europe, industrial demand for natural gas was down 16% in June and was 25% below the pre-war five-year average — helping inventories build and pressuring natural gas prices lower. Germany’s July flash Manufacturing PMI reading of 38.8 is a reminder that the energy-intensive side of the European economy is set to continue to suffer — whether or not a technical recession in Europe persists.
With U.S. industrial price pressures easing and manufactured goods inventories nearing levels requiring restocking, this should signal a recovery in distillate fuel oil demand and help support oil prices moving into the fourth quarter. We expect U.S. gasoline demand to continue to hold below pre-COVID levels, but with inventories well below their historic norms, gasoline cracks should remain strong enough to continue to inspire stronger crude oil inputs at refineries — particularly in the United States.
Looking forward
To start the second half of 2023, oil prices are moving higher on the back of Saudi and Russian supply cuts. U.S. rig counts are dropping following a year of prices sliding lower, which should portend slowing production growth from the world’s largest oil producer and assist in OPEC+’s efforts to limit inventories and support prices. In addition, following a congressionally mandated sale of crude oil from the Strategic Petroleum Reserve this spring, the Biden administration is now beginning to slowly refill inventories rather than release them.
Refining cracks for gasoline and diesel are still elevated relative to historic norms, which should help push refinery runs higher for the remainder of the summer if weather and labor cooperate. However, total margins are not nearly as strong as headline cracks suggest, given that weak naphtha and fuel oil margins somewhat offset stronger margins for on-road fuels. In addition, margins based on heavier crudes, like Western Canadian Select, are not nearly as strong as WTI and Brent-based cracks would suggest. U.S. Gulf Coast refiners are in a uniquely advantageous position given their low input costs and access to the export market, which should assist the Saudis in limiting crude inventories in the most transparent market in the world through the second half of this year.
U.S. refined product stock changes will increasingly be set by the pace of global demand and net exports as we progress through summer, as domestic product demand is likely already at or very near its seasonal peak (particularly for gasoline and jet fuel), and refinery runs should continue higher. While seasonal heating oil demand should help support distillate fuel oil demand as we work toward the fourth quarter, growing refinery capacity globally later this year should limit the appetite for U.S. product exports and pressure refining margins.
Many leading indicators still say a recession is looming in the United States despite the positive surprises to economic growth this year. That said, the timing remains highly uncertain, and it may take an event like another bank crisis or some similar unforeseen result of quantitative tightening to serve as a catalyst. We expect WTI to remain range bound between $70 and $90 bbl, with a bullish bias for the next few months. However, with growing OPEC space capacity and the potential for unplanned outages to be resolved in the coming months, bullish tail risks and extreme high price potentials are limited.
Register for our up-coming U.S. Oil Market Update webinar on August 10, 11 a.m. CDT.
Get unbiased market insights through our trusted energy solutions.
About the authors
Troy Vincent
Troy Vincent is a senior energy market analyst at DTN. He worked at the Charles Koch Institute and studied at the Mises Institute while completing his Bachelor of Science in business economics and public policy from Indiana University and has been in the economic research and energy risk management industry for the past decade. Throughout that period, he has served as an analyst covering electricity, carbon dioxide, coal, natural gas, crude oil, and refined products markets. After advising companies on their energy risk management strategies while at Schneider Electric and Trane, Vincent served as a senior oil market analyst for innovative technology startup ClipperData, providing actionable intelligence for oil traders and investors. He currently specializes in crude oil, natural gas, and refined products markets; you can find his past comments and analysis across industry reports from RBN to Barron’s, MarketWatch, and Bloomberg.
Karim Bastati
Karim Bastati is a market analyst at DTN. Bastati has nearly a decade of experience in data analysis, spending the last few years in the energy industry interpreting data and building predictive models. He often acts as the central link between quantitative and qualitative research, joining an extensive knowledge of global oil markets with an analytical, numbers-oriented approach. In his previous position at ClipperData, he authored several weekly reports on crude oil and petroleum products, delivering data-derived insights.


