MagicVova
Please note all figures are in CAD unless otherwise noted as that is the company’s reporting currency.
Introduction
MEG Energy (TSX:MEG:CA) is a Canadian based energy company focused on sustainable in-situ thermal oil production in the Athabasca oil sands. MEG has developed innovative oil recovery projects that utilize steam assisted gravity drainage extraction methods to improve the economic recovery of oil as well as lower carbon emissions. MEG transports and sells thermal oil (known as Access Western Blendor “AWB”) to customers throughout North America and internationally.
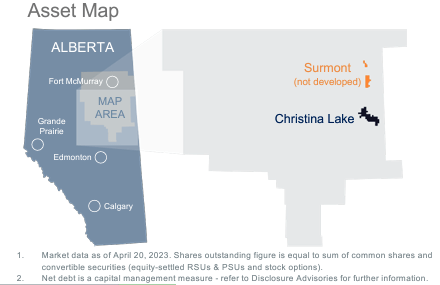
The Christina Lake Project, which contains all the company’s 2P reserves has regulatory approval in place for 210,000 bbls/d of production. The average annual production decline rate at the Christina Lake Project is approximately 10% to 15% and at an annual production level of approximately 103,700 bbls/d, MEG has a 2P reserve life of more than 50 years.
May 2023 Presentation (MEG Energy)
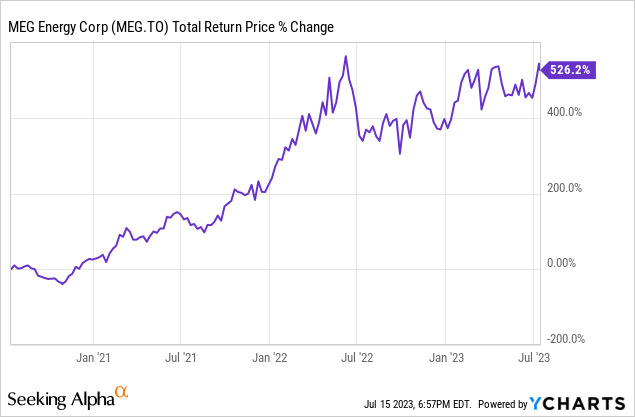
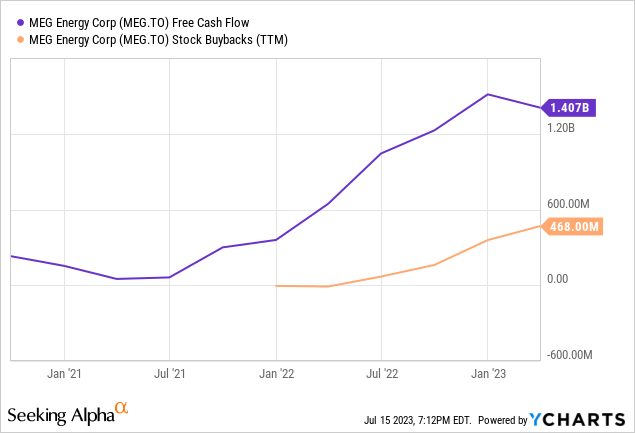
Although the stock has produced very poor returns in the past decade, over the past three years the returns have been exceptional at well over 500% as free cash flows were almost nil prior to 2021 and finished 2022 with over $1.4 Billion. The excess free cash flows have largely been attributable to higher commodity prices but also tightening of WTI-WCS and WTI-AWS differentials for which the company has among the most leverage to in the industry (more on this later). As a result the company nearly halved its net debt between early 2021 to Q1 2023 from ~$2.7 Billion to $1.4 Billion.
Q1 2023 Results
Q1 2023 revenues net of royalties, decreased to $1.4 billion from $1.5 billion in the same period of 2022. The decrease primarily reflected weaker WTI benchmark price and wider WTI-AWB differentials. AFFO and netbacks are the most concerning numbers as the former of which fell 51% since 2022 Q1 and the later by 58%. QoQ these numbers have been on a downward trend since early 2022.
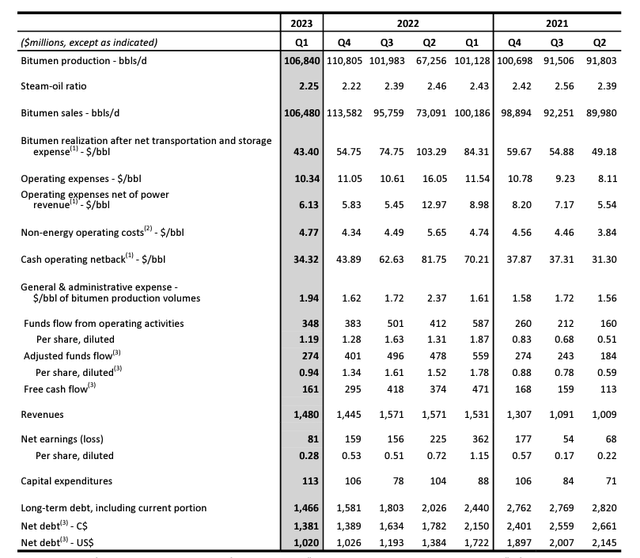
Q1 2023 MD&A (MEG Energy)
What MEG refers to as “blend sales” is revenue from its oil blend known as AWB, which is essentially bitumen produced at the Christina Lake Project blended with purchased diluent. On the plus side the diluent expense tends to be negatively related to the WTI-AWS differential which does act as a small hedge subject to pipeline specification seasonality, the cost of transporting diluent to production sites from Edmonton and USGC markets, and the value of the Canadian dollar relative to the U.S. dollar. The first quarter of 2023 blend sales price decreased 28%, to $76.07/bb, from a high of $105.79/bbl in the first quarter of 2022. The decrease primarily reflects a lower WTI benchmark price and wider WTI-AWB differentials.
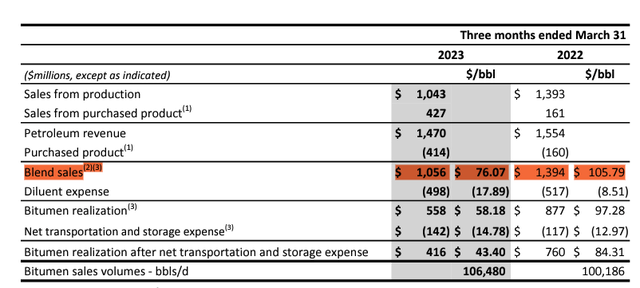
Q1 2023 MD&A (MEG Energy)
AWB typically trades at a slight discount to the Western Canada Select (WCS) for quality differentials and we’ll see below the discount between the WTI and WCS seen in early 2023 was among the highest it has been since 2018 reaching a high of $30/bbl in early January. The differential has narrowed since to $16/bbl which is in line with levels seen through 2021 and 2022.
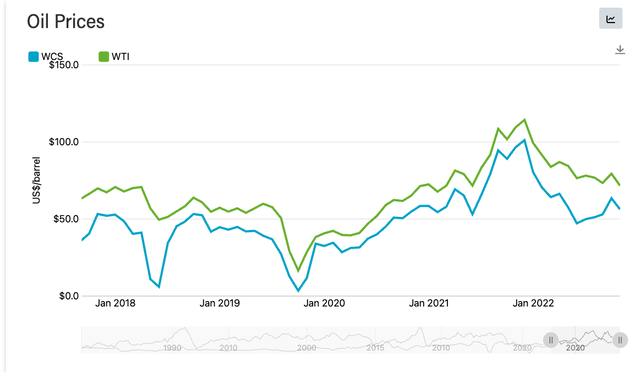
Oil Prices (Alberta Economic Dashboard)
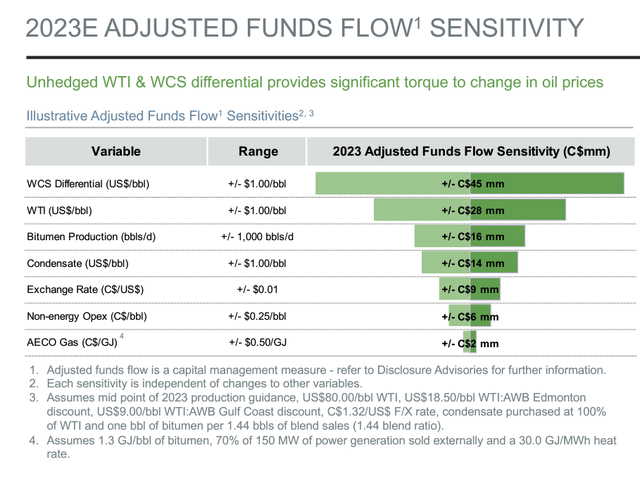
See management is of the belief that the differential will continue to tighten due to easing China COVID restrictions, increased heavy refining capacity as existing turnarounds complete and additional heavy capacity online. On the supply side U.S. Supply Reserve reductions and OPEC production cuts will also help. This is why management has chosen to go the route of remaining largely unhedged as a $1 change in the differential impacts AFFO by $45 Million which is among the highest in the industry. Fortunately their low debt level will provide some downside protection as interest rates should not be too impactful over the next four years and their $450 Million in CAPEX is expected to be self-funded.
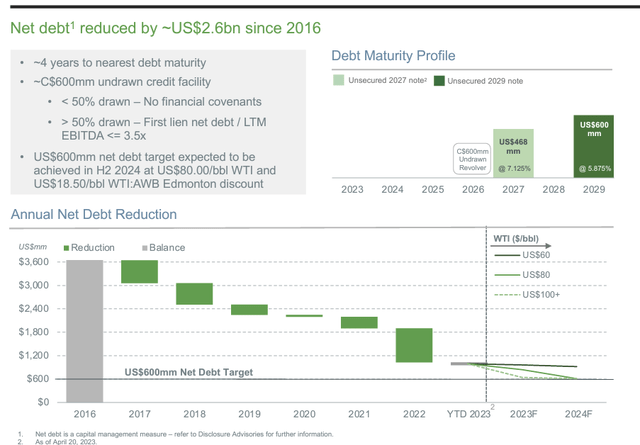
May 2023 Presentation (MEG Energy)
May 2023 Presentation (MEG Energy)
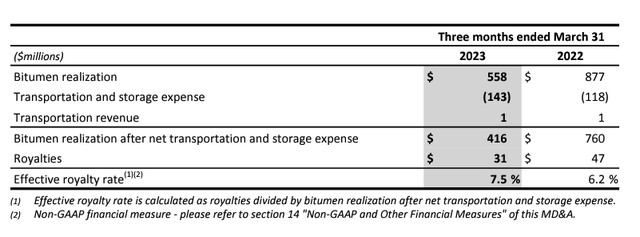
The concerning thing is that netbacks fell sharply in spite of reduced royalty expenses and moderate increases in OPEX. Oil sand regulations established royalty rates that are linked to WTI in Canadian dollars. The royalty payable is calculated on bitumen production and applies price-sensitive royalty rates to gross or net revenue depending on whether the project’s status is pre or post payout. Payout begins when a project has generated enough net revenue to recover costs and provide a sufficient return allowance. When a project reaches payout, its cumulative revenue equals or exceeds cumulative costs.
The pre payout royalty is based on the project’s gross revenue multiplied by a gross revenue royalty rate. Gross revenues are comprised of bitumen realization after transportation and storage expense attributed to the project. The gross revenue royalty rate starts at 1% and increases every dollar the WTI oil price in Canadian dollars is priced above $55/bbl, to a maximum of 9% when the Canadian WTI price is $120 per barrel or higher. The post-payout royalty is the greater of (i) the gross revenue royalty; or (ii) the net revenue royalty. Net revenues are comprised of bitumen realization after transportation and storage expense attributed to the project, and allowed operating and capital costs. The net revenue royalty rate starts at 25% and increases for every dollar the Canadian dollar WTI oil price is above $55/bbl to a maximum of 40% when the Canadian WTI price is $120/bbl or higher.
MEG will have to begin to pay an effective royalty rate of at least 25% before the end of 2023 which will be more than 3X what the current level has been. MEG could be facing a unique set of circumstances of decreasing net backs through both lower commodity prices and rising royalty expenses.
Q1 2023 MD&A (MEG Energy)
Valuation
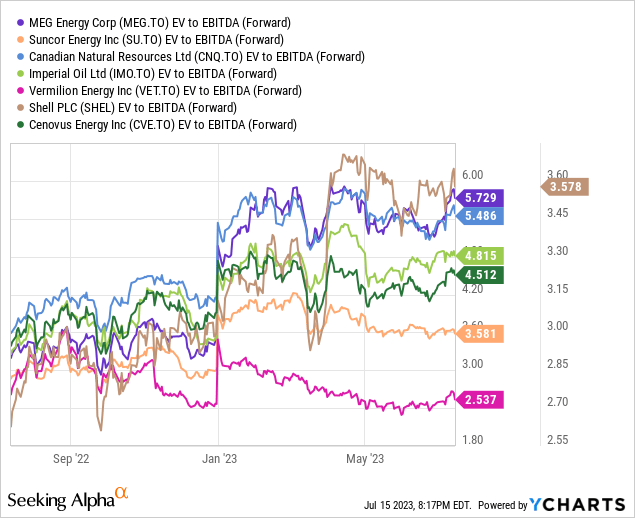
MEG may look undervalued on an absolute basis as only “value traps’ trade at 5X its expected EBITDA for 2023. The problem is that this is the oil and gas industry that has lost a lot of love over the years due to its perception of being volatile and low ESG scores.
Surprisingly MEG trades at a premium compared to not only Vermilion Energy (VET:CA) or Canadian Natural Resources (CNQ:CA) which are more insulated to decreases in WTI-WCS differentials due to their greater geographical exposure but also supermajors like Suncor (SU:CA), Imperial Oil (IMO:CA), Shell (SHEL), and Cenovus (CVE:CA) who actually have greater control over their pricing due to their downstream operations. To put in perspective, how much the standard deviation varies around the mean guidance for MEG versus the others, MEG FFO could fall by more than 28% at average Q1 2023 pricing at 2023 YE from its levels in 202 whereas IMO’s FFO would fall by up to 20%.
Conclusion
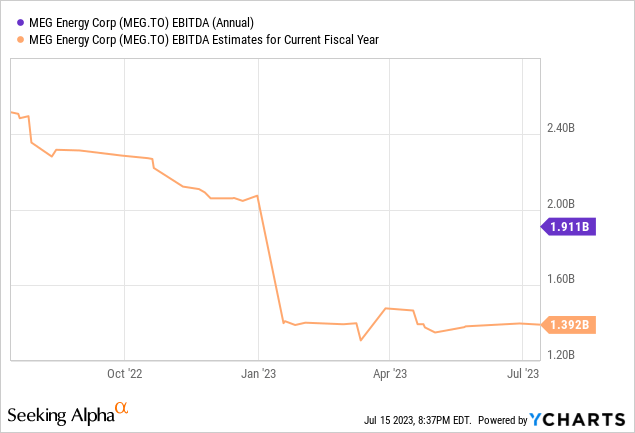
I am still bullish on the oil and gas industry and using even the most conservative assumptions, which the analyst community has will still make MEG highly profitable for 2023. They could still theoretically repurchase $400 Million worth of stock after CAPEX which is in line with 2022 stock repurchases and would be 6% of their market cap. I still believe the other producers mentioned herein provide greater risk/reward profiles and therefore I am staying on the sidelines until a better entry point presents itself.
Editor’s Note: This article discusses one or more securities that do not trade on a major U.S. exchange. Please be aware of the risks associated with these stocks.


