LumerB
The market consensus view seems to be that the U.S. has avoided recession and the soft landing scenario is all but inevitable. This view has been supported by the extraordinary strength demonstrated by equity markets. The price action should not be ignored. The S&P 500 and Nasdaq indexes are setting key technical accomplishments including turning the 200 day moving average up and breaching the 61.8 Fibonacci retracement. All told, it would be extremely odd for a bear market rally to do such things.
Despite the technical signals, we remain cautious on the economy and equity markets. We have published previously that a big part of the market’s momentum has been due to developments in the AI space and added liquidity from global central banks in 2023. In addition, market positioning at the start of 2023 was strongly bullish as speculators have been massively net short equities for most of the year.
We now find ourselves in a unique and difficult situation. As equity indexes are approaching all time highs, yield curves remain deeply inverted. One of these things is wrong. Either this is a bear market rally unlike any other, the yield curves are wrong, or the market has become so sophisticated that the bear market has run its course before the recession has begun. We believe the market is experiencing a unique set of circumstances that allow market participates to price in the probability of no recession but in fact the recession continues to brew and will slowly but surely come to fruition. “When” will depend on when the inverted yield curves begin to steepen once more.
Yield Curves Remain Deeply Inverted And Signal Recession
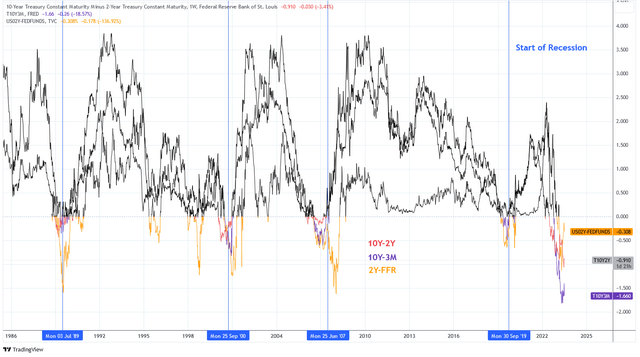
Below is a chart of the three major yield curves: the 10 Year minus 2 Year (red), 10 Year Minus 3 Month (purple), and 2 Year minus Fed Funds rate (orange). For the last four decades, the aggregate of these three yield curves have preceded each recession. There were instances when one yield curve would invert without recession, most commonly with the 2Y-FFR. But an inversion of all three has reliably been a predictor of recession.
Charts by TradingView (adapted by author)
Yield curve inversions forecast recession by two main ways. First, the inversion indicates that the bond market, meaning bond market participants, are sensing that economic conditions are deteriorating and are bidding up long duration bonds relative to short duration bonds. This is risk-off behavior as investors seek out the stability of fixed income assets over risk assets that are more vulnerable to economic weakness. It is also a reflection of investors’ sentiment on future inflation which tends to decline during economic downturns. Short duration rates end up higher than long duration rates partly due to monetary policy which is responding to recent economic strength and often fails to respond to a change in the business cycle promptly.
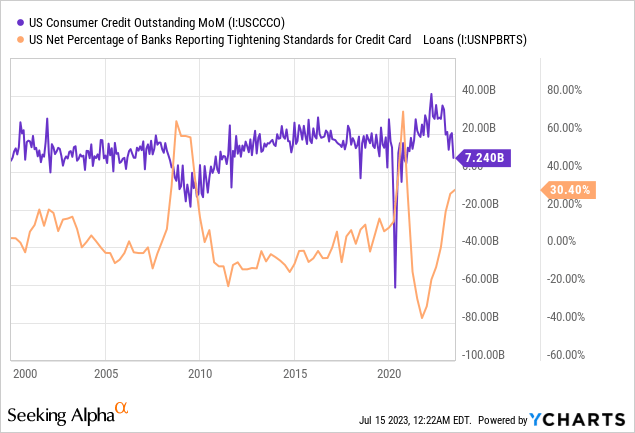
Secondly, yield curve inversion can contribute to the cause of recession. This is done through tighter lending standards by banks as they become under pressure when shorter term rates, which banks typically borrow at, exceed longer term rates, which banks typically lend at. This is why banks often loosen lending standards when yield curves steepen and tighten them when yield curves invert. Tighter lending standards lead to less credit expansion and slower economic activity, which is recessionary.
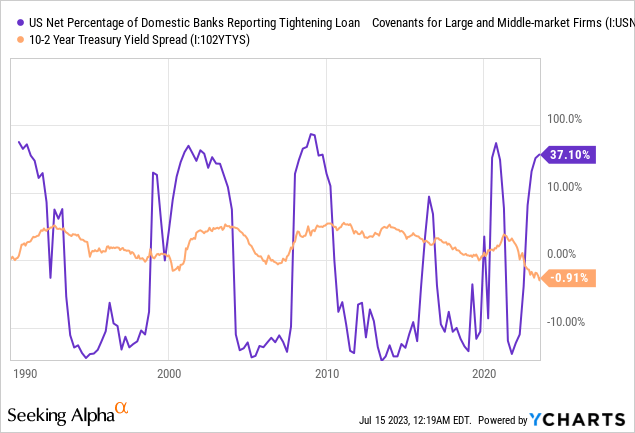
Notice how consumer credit growth slows in correlation with tighter lending standards:
Beware The Yield Curve Steepening
In May, the Cleveland Fed’s Recession Probability within One Year Measure based on the 10Y-3M yield curve hit a cycle high of 79.3%. The measure has never reached 100% in the last 60 years and the last time that the measure was this high was in 1982. The Cleveland Fed also has a GDP forecast based on the yield curve. They expect a YoY change in GDP in June of 2024 to be -3.26%.
The 10Y-3M curve has inverted before every recession since 1960 nearly without error. Investors have become impatient with the recession thesis as the signs of recession remain widely absent in employment data and many facets of economic activity. But it would not be prudent to dismiss the yield curve so quickly. Nothing about the current sequence of events is abnormal.
Referring back to our first chart we can see that the official start date of past recessions have not coincided with the onset of yield curve inversions. Rather, recession has tended to begin as the yield curves steepen and sometimes only after they have reverted positive! As an example, the 2007 recession began after both the 10Y-2Y and 10Y-3M reverted positive. The 2000 recession began after the 10Y-2Y bottomed and began to steepen, but neither that curve nor the 10Y-3M were positive.
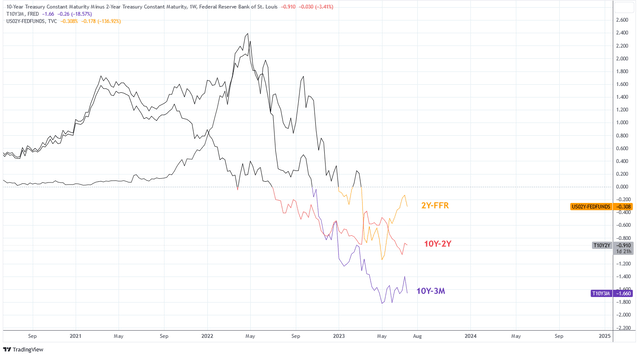
Taking a look at today in the chart below, the 10Y-2Y and 10Y-3M have been marginally steepening over the past few months but neither curve is near the zero bound yet. We believe that its probable these curves have bottomed since the Fed is signaling the end of the rate hiking cycle is near. One thing is certain: eventually these curves will revert. It is expected, then, that if recession is approaching it will begin between now and shortly after that reversion.
Charts by Tradingview (Adapted by author)
The Yield Curve Nobody Is Talking About
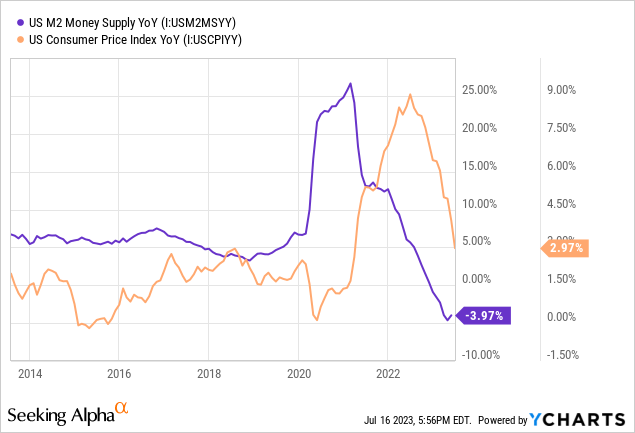
The debate over traditional yield curves is feverish and the proclamations that “this time is different” are widespread. Economist Campbell Harvey, who is considered an innovator in the use of yield curves to predict economic conditions, has even publicly stated that he believes this signal is false. One possible reason why the signal may be false is because of the magnitude and expected duration of the surge in inflation in recent years. The market can see that this surge in inflation was a result of a massive surge in money supply expansion that resulted from monetary and fiscal stimulus efforts during the pandemic of 2020. The stimulus and money expansion has passed and inflation is following it lower, albeit with a lag. It’s possible that these yield curve inversions are a result of an over-reactive Fed raising short term rates excessively and the bond market is bidding long duration bonds higher because it anticipates a quick mean reversion in inflation back to the 2-3% range.
The theory is plausible. But it fails to recognize the full impact of yield curve inversions on the economy itself. We have already discussed how yield curve inversions can contribute to the cause of recession. To expand on that hypothesis, we like to examine mortgage rates. Below is a chart of the spread between the 30 Year Mortgage rate in the U.S. and the yield on the 10Y Treasury. The spread has expanded to its highest in decades over the past year. Housing and equity bulls point to this abnormal spread as evidence that a quick economic recovery is possible because mortgage rates can decline by 150 basis points to return to average and relieve pressure in the residential housing sector.
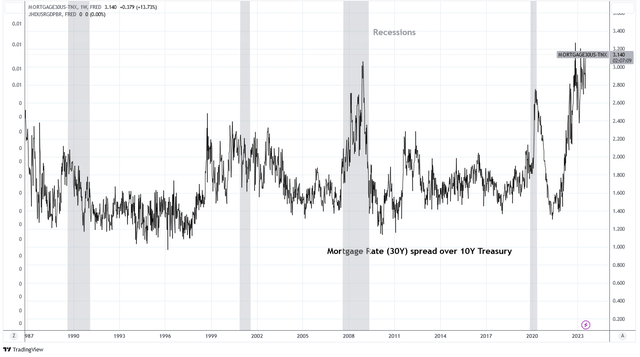
Charts by Tradingview (adapted by author)
One explanation for the wide spread is that mortgage lenders are pricing in the risk of refinance. When lenders expect rates to decline in the near term they must protect themselves from the risk that mortgage borrowers will quickly refinance their mortgage loans at lower rates. By paying off their mortgages early, the lenders do not experience the returns that were expected at the time of issuance which deteriorates profitability. To protect themselves from refinance risk lenders will expect a higher risk premium.
But in addition to risk premium, lenders are also under increased pressure when short term rates rise. Some mortgage lenders borrow capital short and lend long and profits are produced from the arbitrage. But when short term rates are higher than long term rates, during yield curve inversions, it makes lending more difficult.
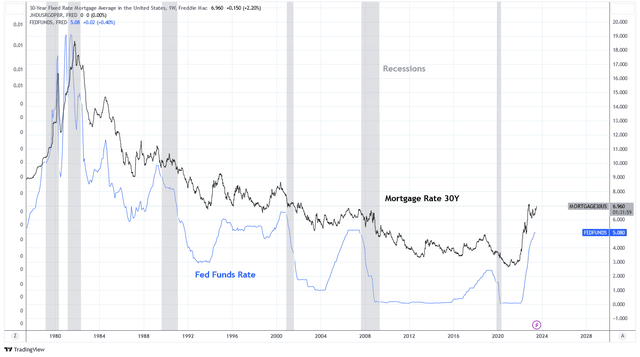
Below is the chart of the spread between the U.S. 30 year mortgage rate and the Fed Funds Rate, a benchmark for short term rates. The average spread since 1970 is approximately 300 basis points. Today, the spread is 188 basis points. While the spread rarely inverts, a tight spread often occurs during yield curve inversion. A spread of approximately 140 basis points is a warning level that tends to be reached prior to past recessions.
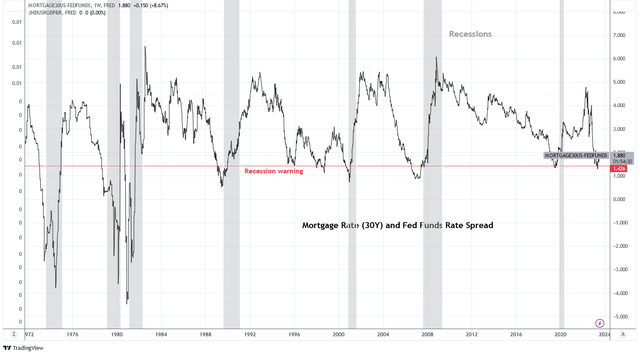
Charts by Tradingview (adapted by author)
Why is this yield curve so important? It begins with the fact that the residential housing market in the U.S. is a major driver of economic activity. Housing market activity is responsible for a significant proportion of U.S. jobs as the National Association of Realtors estimates that every 1,000 home sales is responsible for supporting an estimated 500 jobs. In addition, borrowing for housing purchases and renovations is a large contributor to credit creation that stimulates economic activity. Mortgage originations impact total credit creation and major contractions in mortgage originations lead to credit contractions that contribute to recessionary influences. When mortgage rates rise, it tends to decrease home sales activity and vice versa. This explains the recent drop in home sales and mortgage originations.
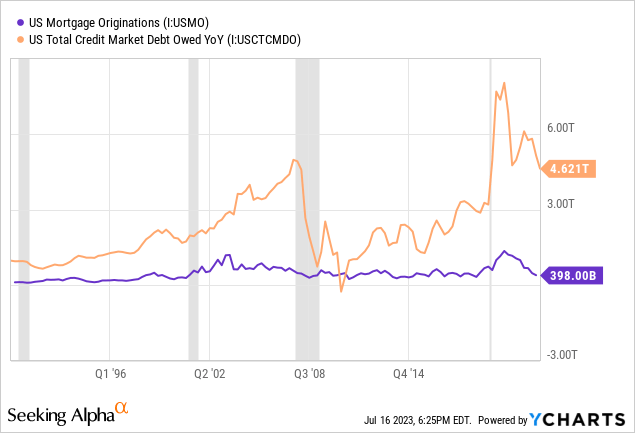
After 1985, the widening of the Mortgage to Fed Funds spread consistently occurs with both rates declining and the Fed Funds Rate declining by more than the mortgage rate. This is consistent with the other yield curves; steepening most often occurs as short end rates decline faster than long end rates. This is typical for scenarios of economic downturn as policymakers drop interest rates to recover economic activity.
Charts by TradingView (adapted by author)
Conclusion
For this cycle to “buck the trend” and avoid economic downturn, we expect that the yield curve inversion must be resolved with long end rates rising above short end rates. This is our expectation because the Fed is under pressure and disincentivized to drop short end rates unless prompted by the need to stimulate the economy. This is because inflation continues to exceed their target objective. If the economy does remain resilient, the Fed will not be motivated to cut interest rates. We find this scenario to be unlikely given the impact that yield inversions have on the economy itself and the predictive ability of the signal. If the Fed Funds Rate were to remain stable, mortgage rates would need to increase by 100 basis points to mean revert. Without a decline in home prices to compensate for the increased debt service cost, or an increase in income to service higher payments, housing activity should decline further.
The current sequence of events that have transpired in credit markets is consistent with a normal economic cycle that is transitioning from the peak to contraction stage. The evidence is not yet compelling to us that economic signals from yield curves are currently false. Given the duration and recent movements in yield curves, we anticipate economic turmoil to transpire over the coming quarters.


