


Bilal photos
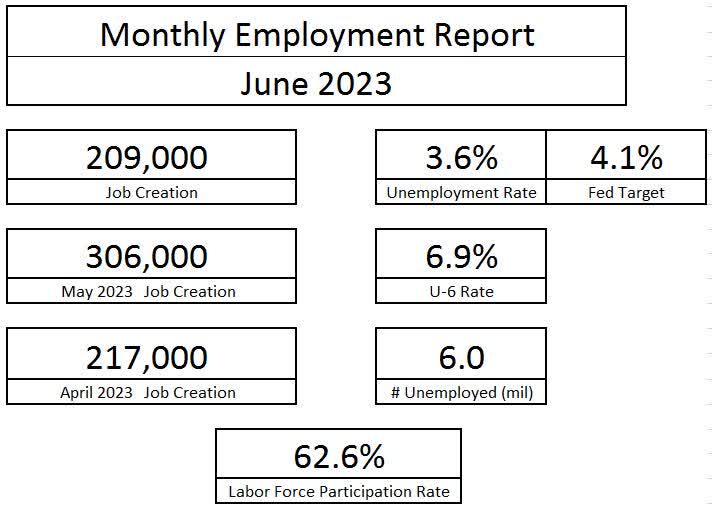
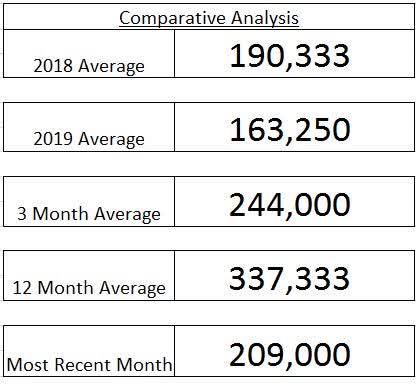
Last Friday, the Bureau of Labor Statistics surprised the markets with a tame June employment report. The report indicated that the U.S. created 209,000 jobs in the month of June, below the consensus of 240,000 and far off the nearly half a million estimated by ADP the day prior. While the monthly jobs number pulled back towards the more normalized labor reports of 2018 and 2019, the unemployment rate dropped to 3.6%, falling further behind the Fed’s 4.1% target for 2023. Despite the easing back in job creation, the labor market remains heavily constrained and is still feeding our inflationary problems.
Bureau of Labor Statistics
Bureau of Labor Statistics
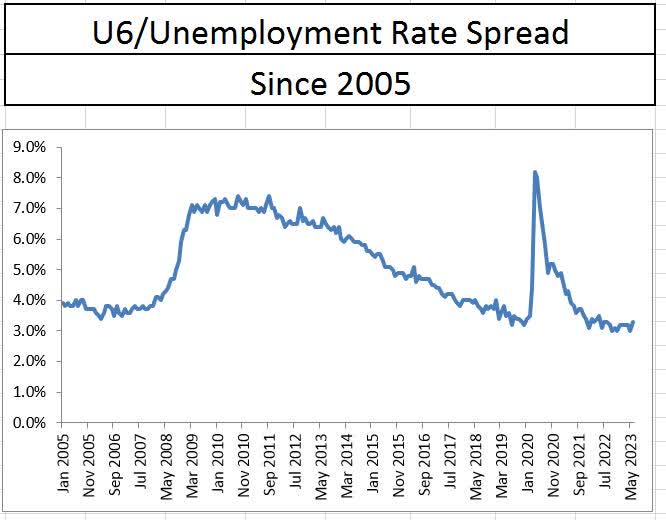
With the decline in job creation, the increase in U6 unemployment showed hopes of the labor market cooling. U6 unemployment is a combination of the currently unemployed and those who are marginally attached to the labor force (workers who want to work more hours, discouraged, etc.). While the rise in the U6U3 gap shows that the more workers are working below the number of hours they want, but it is not necessarily indicative of a trend. In the first quarter of 2019, U6 rose before the labor market tightened to levels not seen in the post financial crisis economy.

Bureau of Labor Statistics
Bureau of Labor Statistics
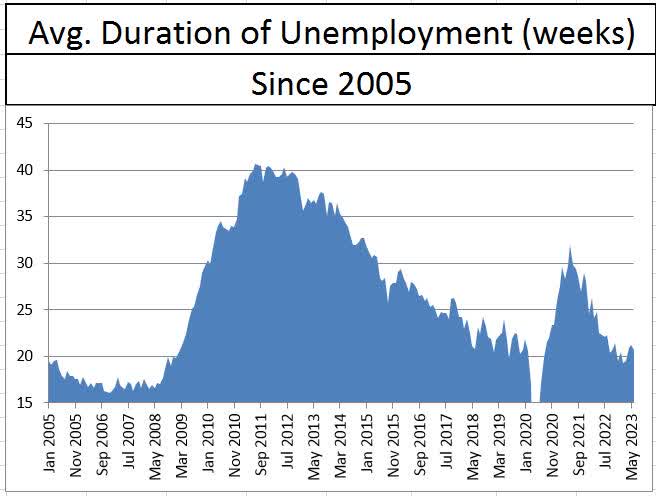
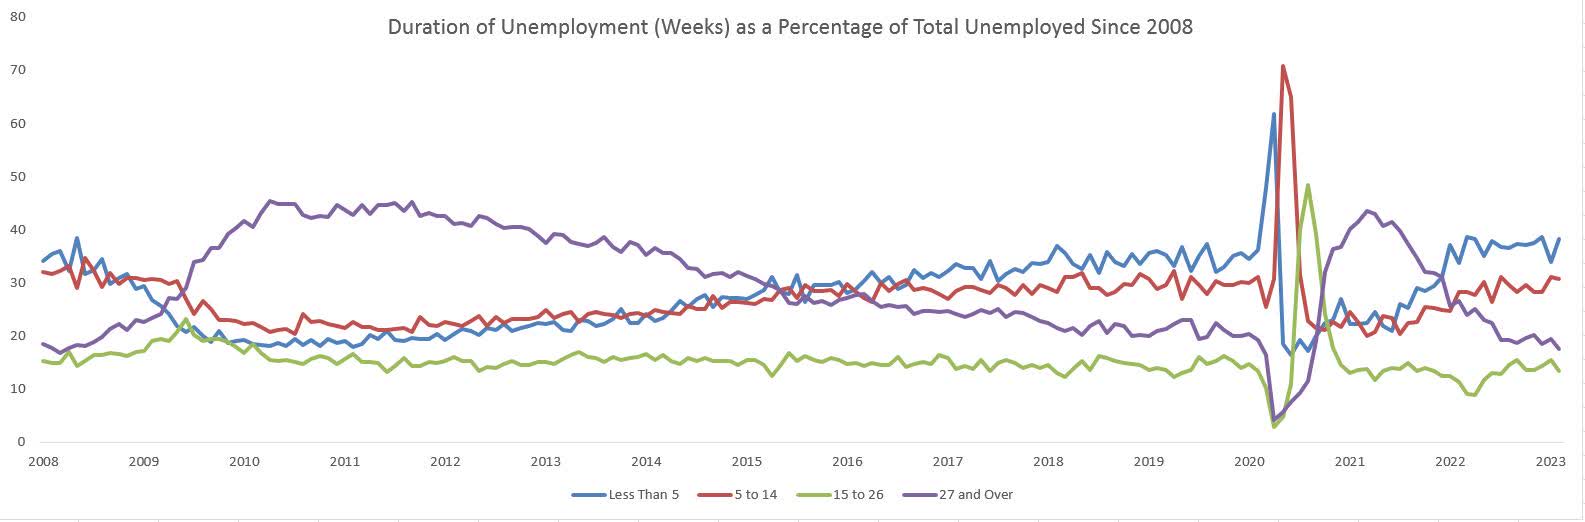
Unemployment duration is a favorite of mine when looking at the health of the labor market. If workers are needing more time to find new work, it is indicative of a slowing job market and thus weakening economy. While average unemployment duration and the total number of workers unemployed over 27 weeks had been rising over the past couple of months, those numbers declined in the month of June. Workers who are unemployed are still having an easy time finding work. Furthermore, the percentage of total unemployed workers looking for work for more than 5 weeks declined in June, further representing that the labor market remains tight.
Bureau of Labor Statistics

Bureau of Labor Statistics
Bureau of Labor Statistics
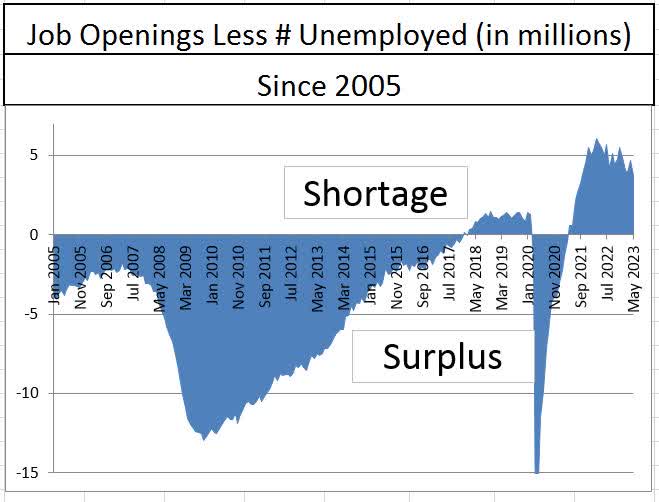
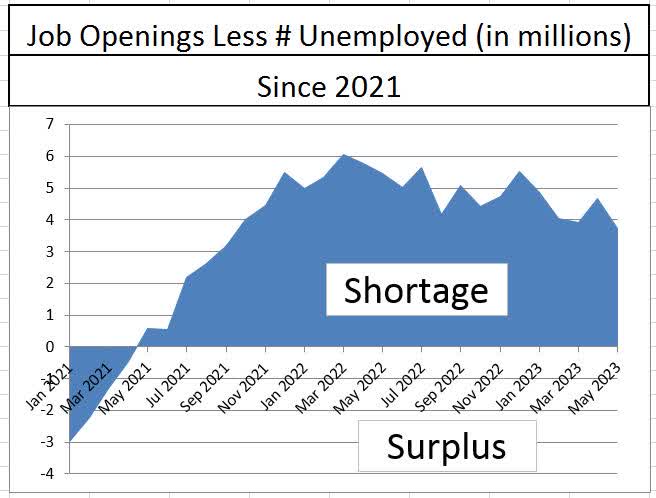
Another good measure of the labor market lies in comparing the BLS job openings report against the number of unemployed in the jobs report. Even before the financial crisis of 2008, there were more unemployed persons than open positions. A shortage started in 2019, but after COVID, it exploded, with many months of 5 million more job openings than unemployed persons. According to May’s job openings report, the number of job openings exceeding the number of unemployed dropped to its lowest level since late 2021 but remains at a shortage of more than 3.5 million jobs.
Bureau of Labor Statistics
Bureau of Labor Statistics
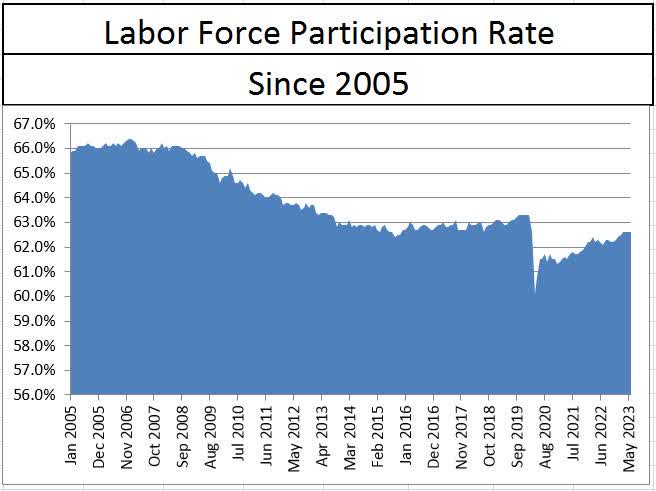
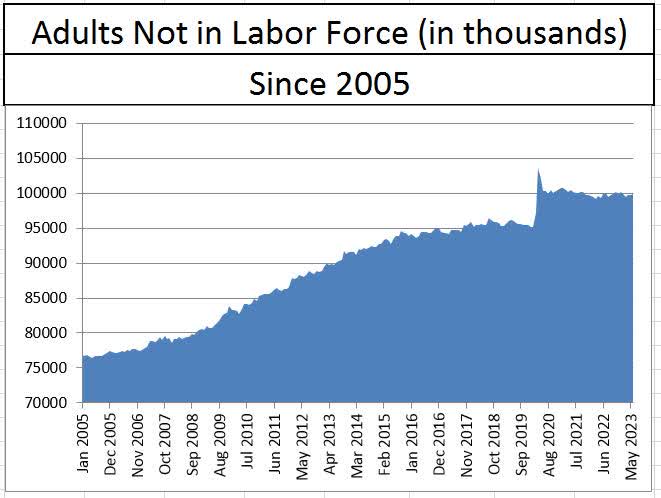
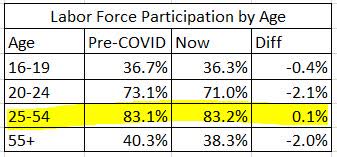
While some may believe the labor shortage is due to an overwhelming demand for labor by employers, it appears as if the greatest pain is coming from the supply side. Labor force participation remains below pre-pandemic levels and has stalled out over the last few months. The cause of lower labor force participation lies in the surge of workers aged 55 and over who left the workforce when COVID-19 hit. The labor force participation among workers aged 25 to 54 remains stronger than the last business cycle but aged 55 and over is notably lower. These workers have left and are likely not returning.
Bureau of Labor Statistics
Bureau of Labor Statistics
Bureau of Labor Statistics
One silver lining in the June jobs report is in the area of average hourly earnings. This data point has moved in tandem with inflation in recent years. The increase in average hourly earnings on a year over year basis continued to fall in the month of June, leading to the possibility that core inflation may be soon to follow. Should the labor force face new strains, investors can expect wages and prices to rise and force the Fed’s hands into further interest rate hikes.

Bureau of Labor Statistics
Overall, the supply side strains that have beleaguered the labor market remain in place, but fortunately, they have not gotten worse. Wages are easing down but remain well above the Fed’s inflation target. Job growth has slowed, but the Federal Reserve still needs more than 3.5 million jobs to go away before achieving parity in the labor market. If investors were hoping for a rate pause, it won’t come due to the June jobs report.


